 Some good jobs news: “Solar is the fastest-growing industry in the US” according to Rhone Resch, President of The Solar Energy Industries Association (SEIA), during his remarks accompanying release of the quarterly report “US Solar Market Insight.” The report was jointly prepared and released by SEIA and Greentech Media (GTM).
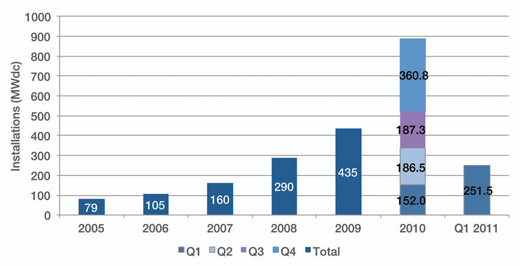
The graphic at right summarizes the stunning growth of the solar industry. Here are highlights from the report:
Solar Driving Jobs Creation
Rhone Resch said that the solar industry employs 100,000 Americans and that that number could double in the next two years. Within a few years, the US will be the world’s largest solar market, according to SEIA.
While California, New Jersey, and Arizona remained the top three states for solar installations, Pennsylvania jumped to the number 4 position, from number 8 in the rank last year. Maryland made the biggest move from 16th to 8th in the ranks.
Solar Growing Fast
Solar electric installations surpassed one gigawatt for the first time, and the US shows signs of being one of the top, if not the top global market for solar in the coming years. New solar photovoltaic (PV) installations for Q1 2011 grew 66% over Q1 2010. Total growth of the US solar market was up 67% in 2010, over 2009.
Solar industry manufacturing growth exceeded 31%, compared to less than 4% for overall manufacturing in the US in 2010.
Solar Pricing Continues To Improve
In Q1 2011 for the solar industry, jobs were up, installations were way up for PV and Concentrated Solar Power (CSP), manufacturing growth was up and prices are coming down. Solar system pricing is down 15 percent from Q1 2010.
While fossil fuels continue getting more and more expensive and extraction of oil, gas and coal becomes more and more toxic, the much cleaner renewable energy sector, including the solar industry, pricing is getting cheaper and cheaper.
Key Details
Photovoltaics (PV):
- Grid-connected PV installations in Q1 2011 grew 66% over Q1 2010 to reach 252 MW.
- Cumulative grid-connected PV in the U.S. has now reached over 2.3 GW.
- Cumulative grid-connected solar electric (PV and CSP) has now reached 2.85 GW.
- The top seven states installed 88% of all PV in Q1 2011, up from 82% in 2010.
- Commercial installations in Q1 2011 more than doubled over Q1 2010 in 10 of the top 21 states.
- U.S. module production increased by 17% relative to Q4 2010, from 297 MW to 348 MW. While production from export-oriented firms and facilities dipped materially because of soft demand in the key feed-in tariff markets of Germany and Italy, plants that serve the domestic market enjoyed far healthier utilization of manufacturing capacity.
- After a year of flat-to-increased pricing for some PV components in 2010, annual beginning-of-year feed-in tariff cuts and depressed global demand in Q1 2011 resulted in substantial price declines. Wafer and cell prices dropped by around 15% each, while module prices fell around 7%.
Concentrating Solar Power (CSP):
- The 500-MW Blythe CSP plant obtained a $2.1 billion DOE loan guarantee.
- Construction is underway on the-30 MW Alamosa CPV plant, with expected completion in 2011.
- There is a concentrating solar (combined CSP and CPV) pipeline of over 9 GW in the U.S.; more than 2.4 GW have signed power purchase agreements.
- In total, 1,100 MW of CSP and CPV are now under construction in the U.S.
All Solar Markets:
- The total value of US solar market installations grew 67 percent from $3.6 billion in 2009 to $6.0 billion in 2010.
- Solar electric installations in 2010 totaled 956 megawatts (MW) to reach a cumulative installed capacity of 2.6 gigawatts (GW), enough to power more than half a million households.
Solar PV installations continue their exponential growth.

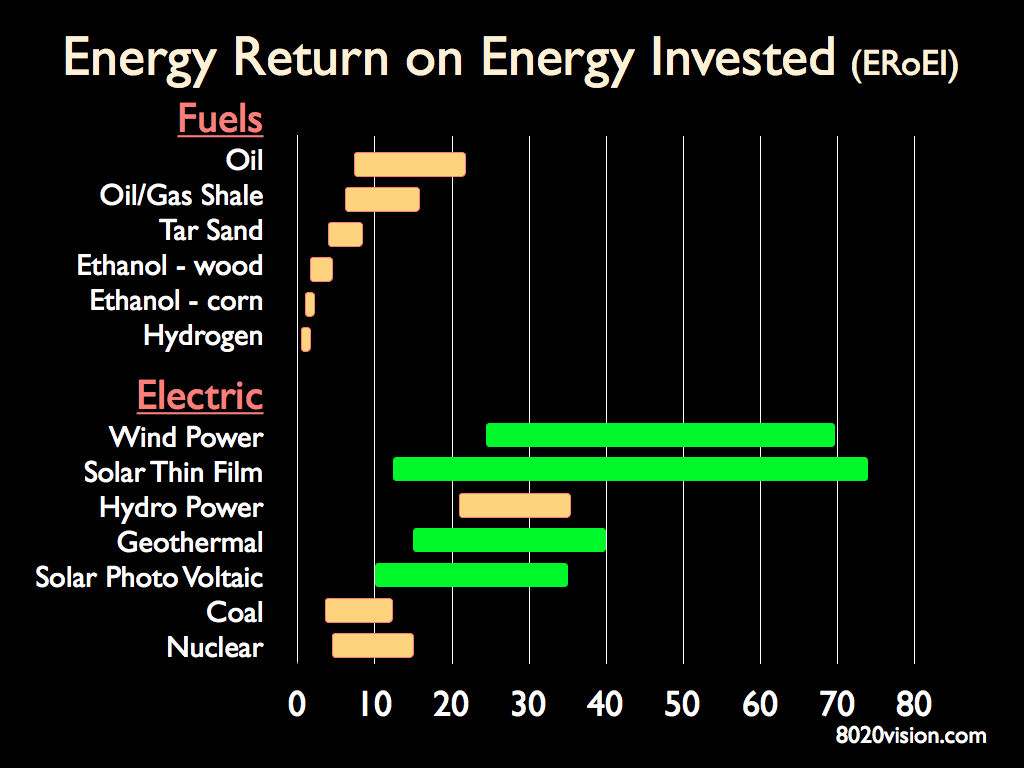
The extraordinary growth of solar makes sense. Think of sunlight as free oil. It’s all around us every day, available for collection. No need for drilling and no threat of oil spills or toxic emissions. Solar panels convert the free energy into electricity or heat. And they do it with remarkable efficiency. It takes energy to produce energy, and to my mind, one of the most important ways to measure the energy performance of something is by calculating the Energy Returned on Energy Invested (ERoEI) – which measures how much energy it takes to produce the energy. The higher the ERoEI, the better. Here’s a chart showing the ERoEI for various energy sources.
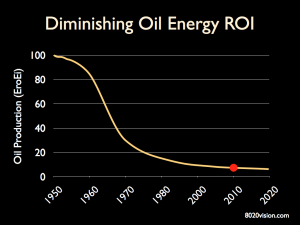
 Solar and wind have the highest ERoEI of all sources of energy, and they are trending higher. Meanwhile, looking at oil, the easy oil has been extracted, what remains is increasingly expensive and difficult to get to, and toxic to extract and process. It takes much more energy to produce a barrel of oil today than it did just 50 years ago. Oil’s ERoEI has plummeted from about 100:1 in the 1950’s to about 10:1 today.
In the US Energy Information Administration’s most recent Monthly Energy Review, they show that domestic production of renewable energy has surpassed that of nuclear power.
During the first quarter of 2011, renewable energy sources (note that this includes biomass/biofuels, geothermal, solar, water, wind):
- Provided 11.73 percent of U.S. energy production.
- Delivered 5.65 percent more than that from nuclear power.
- Energy from renewable sources is now 77.15 percent of that from domestic crude oil production.
Looking at just the electricity sector, according to the latest issue of EIA’s Electric Power Monthly, for the first quarter of 2011, renewable energy sources (biomass, geothermal, solar, water, wind) accounted for 12.94 percent of net U.S. electrical generation — up from 10.31 percent during the same period in 2010.
In terms of actual production, renewable electrical output increased by 25.82 percent in the first three months of 2011 compared to the first quarter of 2010. Solar-generated electricity increased by 104.8 percent, wind-generated electricity rose by 40.3 percent, hydropower output expanded by 28.7 percent, and geothermal electrical generation rose by 5.8 percent. Only electricity from biomass sources dropped, by 4.8 percent. By comparison, natural gas electrical output rose by 1.8 percent and nuclear-generated electricity increased by only 0.4 percent, while coal-generated electricity dropped by 5.7 percent.
The chart below is a concise view of the energy flow from various energy sources and destinations. Though it is only current through 2009, it gives a remarkable view into the complex landscape of where our energy comes from and how we use it.

U.S. Solar Market InsightTM Background Materials:
The U.S. Solar Market Insight: Year-in-Review 2010
The Q2 2011 edition of US Solar Market Insight will be available in September 2011.
Other Background Materials:
2010 National Solar Jobs Census
US Solar Energy Trade Assessment 2010 report finds the US is a net exporter of solar products
