Better, Cheaper, and Fairer Health Care

Keywords: healthcare, cost, life expectancy, t.r. reid, Japan, US

Washington Post reporter, documentary film correspondent and author T.R. Reid had a brief piece in Newsweek this week about Japan’s healthcare system. The article expands on an earlier interview Reid did on National Public Radio (NPR) – Japanese Pay Less for More Health Care – which you can listen to here.

To put Japan’s healthcare in perspective with the US and other countries, let’s look at healthcare performance data from the Organization for Economic Co-operation and Development (OECD). Using graphing approaches from National Geographic and Andrew Gelman we plot annual healthcare spending, life expectancy, and number of office visits per person, for a broad range of OECD countries. (NB: The area of the circle for each country is proportional to the number of doctor visits per person, e.g. Japan is 13.4 visits per year, US is 4 visits per year)

HealthcareSpending, Life Expectancy, Doctor Visits
(source: OECD Health Data 2009)

As can be seen, the US spends the most for healthcare, has middle of the road life expectancy, and few office visits. Japan has the highest life expectancy, three times as many office visits, at a third of the cost, compared to the US.

Commentary on the OECD data from National Geographic article The Cost of Care:

The United States spends more on medical care per person than any country, yet life expectancy is shorter than in most other developed nations and many developing ones. Lack of health insurance is a factor in life span and contributes to an estimated 45,000 deaths a year. Why the high cost? The U.S. has a fee-for-service system—paying medical providers piecemeal for appointments, surgery, and the like. That can lead to unneeded treatment that doesn’t reliably improve a patient’s health. Says Gerard Anderson, a professor at Johns Hopkins Bloomberg School of Public Health who studies health insurance worldwide, “More care does not necessarily mean better care.”

Highlights of T.R. Reids article – Japan shows how it’s done: keep quality up, costs down, and M.D.s on board

To gauge a health-care system’s success, it’s standard to consider three points: quality, coverage, and cost. On all three measures, Japan stands at or near the top in every comparative ranking.

Quality: The Japanese have the world’s longest life expectancy and the best recovery rates from just about every major disease. Infant mortality is less than half the U.S. rate. Japan usually leads the world in rankings of “avoidable mortality”—its effectiveness in curing diseases that can be cured.

Coverage: Japan’s health-insurance system covers everybody, including illegal aliens. It pays for physical, mental, dental, and long-term care. The Japanese are the world’s most prodigious consumers of medical care; on average they see the doctor about 15 times per year, three times the U.S. norm. They get twice as many prescriptions per capita and three times as many MRI scans. The average hospital stay is 20 nights—four times the U.S. average.

Cost: And yet Japan produces all that high-quality care at bargain-basement prices. The aging nation spends about $3,500 per person on health care each year; America burns through $7,400 per person and still leaves millions without coverage.

Japan has universal coverage, but it’s not “socialized medicine.” It’s largely a private-sector system. There is government insurance for the unemployed and the elderly, but most people rely on private plans. Japanese doctors are the most capitalist and competitive in the world. But we’re talking Japanese-style free enterprise here; there’s significant government regulation of the private players. Health insurers are required by law to cover everybody, and to pay every claim; the corollary is that everybody is required to buy health insurance. The price for a given treatment is identical everywhere in Japan. Officials say this is designed to attract doctors to rural communities, but that’s not working very well; many small towns on the outer islands have no doctor at all these days.

That fee schedule is the key to cost control in a country where people love going to the doctor. Basically, it shafts doctors and hospitals, paying some of the lowest fees on earth. As a result, doctors work long hours. They are comfortably middle-class, but not in the country-club set. But the savings can be huge in the high-tech realm that drives U.S. bills so high. An MRI scan of the neck region—routinely $1,400 or so in America—is $130 in Japan. Cost cutting like that has stimulated innovation and efficiency. Low fees are taking a toll, though. In a sense, Japanese medicine is the mirror opposite of America’s. We spend too much on health care, but still cover too few of our citizens; Japan provides lots of care to everybody, but probably spends too little to make its best-in-the-world system sustainable.

Reid’s bestselling book The Healing of America: A Global Quest for Better, Cheaper, and Fairer Health Care is available in paperback.
The Real Population Problem

Google Trends tells me that starting in 2008 the monthly number of news stories on population doubled. Most of the stories like to talk about how global population will expand by 30%, peaking at about 9.1 billion people by around 2050.  Though 2050 is a nice round number, and a convenient mid-century marker, one can be lulled in to feeling like it’s a problem that is 40 years off. Not so. The population problem is here and now. And it’s not just about the number of people on the planet, but how those people consume resources.  Let’s take a look at the pertinent trends.

Energy and Population

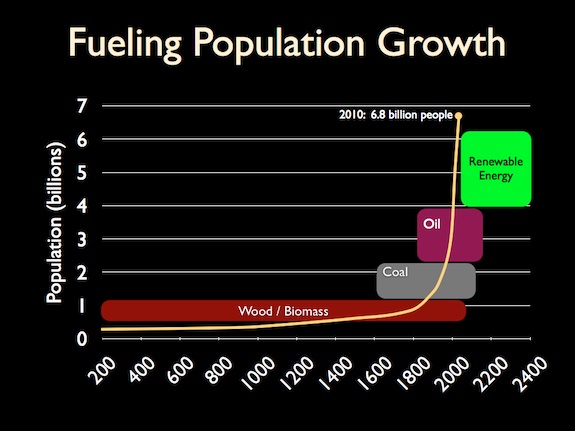
The rate of population growth has a strong correlation with the effectiveness of the dominant fuel source at any given point in history.  As the chart below shows, wood was the dominant fuel until coal came on the scene in the 1600s. The population growth rate increased modestly with the proliferation of coal.  But the real exponential growth began with the discovery and exploitation of crude oil.  Crude oil production is peaking and the world is in the early stages of a transition from fossil fuels to renewable sources of energy.

Fueling Population Growth


China, Brazil and India – Chasing the American Dream

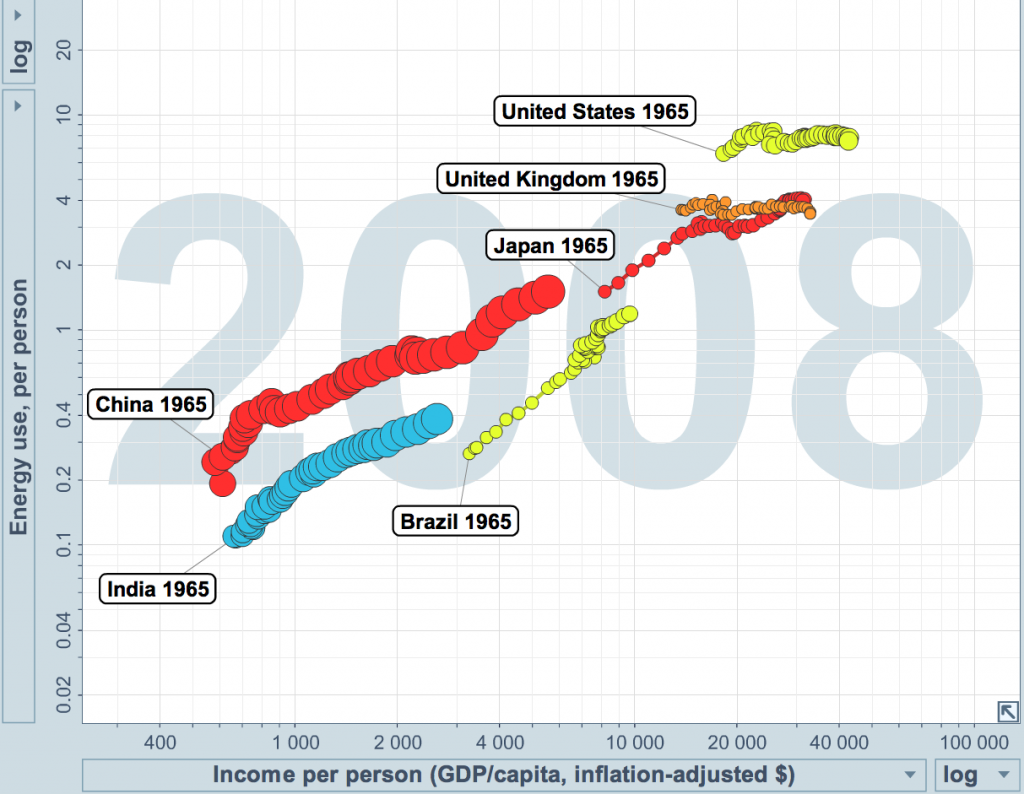
As the population has grown, per capita income and consumption have grown. The most dramatic growth has been in the developing countries of China, Brazil and India. Let’s take a look at the trends in energy use and per capita income relative to some of the leading developed nations. Using GapMinder’s Trendalyzer with energy consumption data from BP’s Statistical Review of World Energy 2010 and income data from the IMF, we can see some powerful trends unfolding (N.B. data presented for 1965 through 2008, 1 year steps, circle area proportional to population size, energy use in tonnes of oil equivalent):

  • China, Brazil, and India all show steadily increasing per capita income, with China having the biggest change – outperforming India and Brazil more than 2 to 1.
  • Though US per capita energy consumption is substantially larger than China, Brazil or India, growth has been flat. This comes from conservation initiatives (efficient lighting, insulation, etc.). We must do better.
  • China, Brazil, and India’s energy consumption is growing quickly as they move toward American patterns of consumption. The trend is strong and steady, with no signs of slowing.
Regional Energy Consumption and Income Trends
(click for larger image)


Less Is The New More

Though Americans represent only 5% of the world’s population, we are consuming about 24% of worlds energy. We are similarly voracious consumers of water, food, land, etc. Citizens in developing nations aspire to live the American lifestyle. Fareed Zakaria refers to this as the “rise of the rest” in his book A Post American World. But the world has only so much to give. Much of what we consume is not renewable. We are bumping up against the limits of earth’s ability to provide for us. As the population expands, for developing nations, their historically meager slice of the pie will expand. For developed nations, their slice of the pie must contract.


Our Ecological Footprint

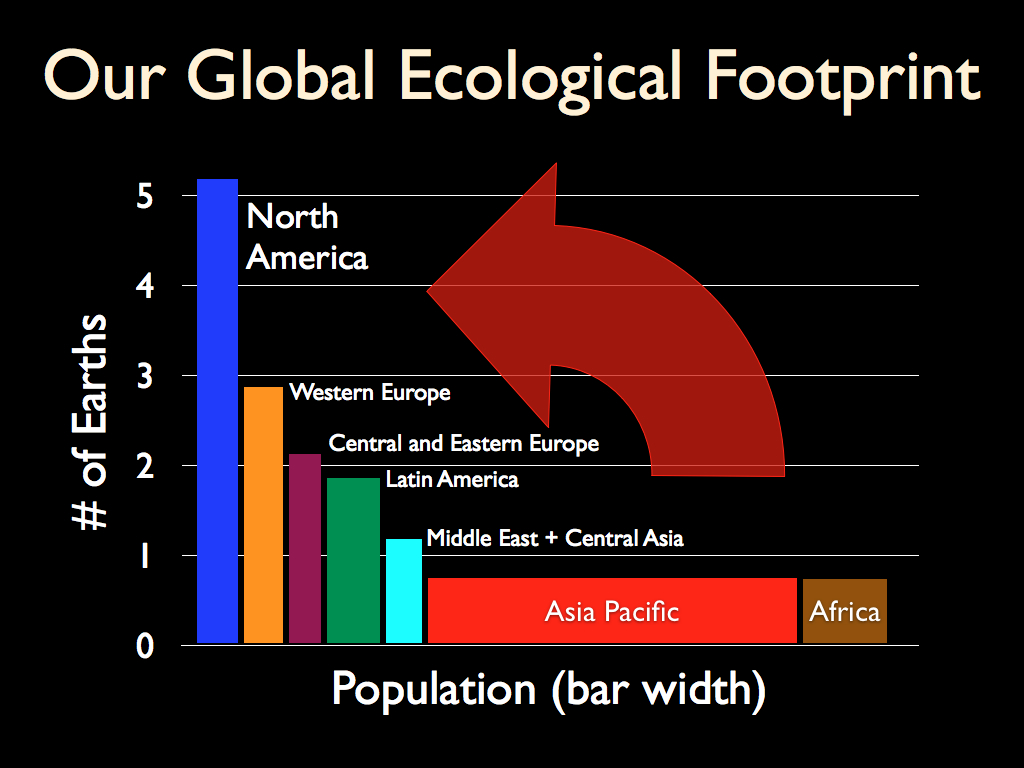
Using ecological footprint data from Global Footprint Network we can see the current state of consumption for North America and the rest of the world (N.B. width of bar proportional to population in associated region).

Global Ecological Footprint

N.B. Ecological Footprint accounts estimate how many Earths were needed to meet the resource requirements of humanity for each year since 1961, when complete UN statistics became available. Resource demand (Ecological Footprint) for the world as a whole is the product of population times per capita consumption, and reflects both the level of consumption and the efficiency with which resources are turned into consumption products. Resource supply (biocapacity) varies each year with ecosystem management, agricultural practices (such as fertilizer use and irrigation), ecosystem degradation, and weather.
 
This global assessment shows how the size of the human enterprise compared to the biosphere, and to what extent humanity is in ecological overshoot. Overshoot is possible in the short-term because humanity can liquidate its ecological capital rather than living off annual yields.

Carrying Capacity

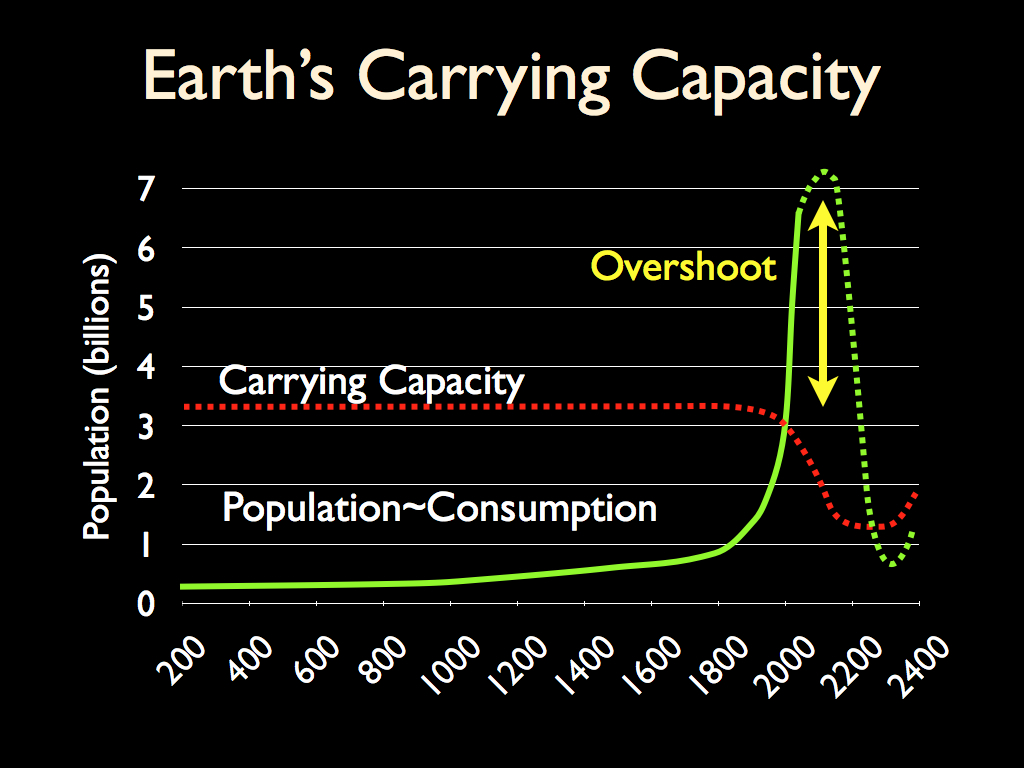
The last sentence of the note above is important. The developed nations are already consuming beyond the earths capacity to provide. Carrying Capacity has been exceeded and as it is exceeded, Carrying Capacity declines. While developed nations are making headway improving conservation, there has been little reduction of consumption – we have simply slowed the rate of per capita consumption. Meanwhile developing nations are moving up the consumption curve, aiming for an American-class lifestyle. Depletion of earth’s precious resources accelerates – oil, potable water, wild fish, species, clean air, etc. are all in decline. Earth’s Carrying Capacity is thought to be somewhere between 1 and 3 billion people. We have been operating the planet well beyond that for almost 50 years now.

Earth's Carrying Capacity

Even if the population stopped growing today, we are consuming beyond the earth’s capacity to provide. With 6.8 billion people already on the planet, the growth of consumption is the population problem, right now.

Zacharia suggests “As each country rises up, they become more self confident and nationalistic, and less inclined to cooperate in global unity toward a common goal of tackling the pressing problems of this century.”

And quoting Hamlet: “There’s the rub.”

  • Population has grown beyond the Carrying Capacity of the earth.
  • Increasing demand for critical resources (energy, water, food, land, …) reduces Carrying Capacity further, and accelerates decline exponentially.
  • Climate is changing, pollution growing, species extinction accelerating.
  • And our ability to work cooperatively to meet these challenges is failing.

This is not sustainable.

How do we break the vicious spiral? How can our global economy – grown soft and pudgy during the 20th century’s age of abundance – adapt and function in the lean and mean dog days of the 21st century?