Hedrick Smith: Who Stole the American Dream?

Veteran investigative reporter and Pulitzer Prize winner Hedrick Smith’s new work, Who Stole the American Dream?, steps back from the partisan fever of the 2012 campaign to explain how we got to where we are today — how America moved from an era of middle class prosperity and power, effective bipartisanship, and grass roots activism, to today’s polarized gridlock, unequal democracy and unequal economy that has unraveled the American Dream for millions of middle class families.

On 22 September 2012, Hedrick Smith spoke at the Parish Hall on Orcas Island, WA, as part of the Crossroads Lecture Series. He spoke for about an hour, followed by a 20 minute question and answer session. His book is available on Orcas Island at Darvill’s Bookstore (a signed copy), or at Amazon.

Smith’s book is brimming with fascinating insider stories that detail the shift from  a strong middle class of the 50s and 60s, to the current weakened middle class, with an income inequality that is at an all time high, ranking with that of Rwanda and Uganda.

This didn’t happen by accident. Smith details how, beginning in the 1970s, corporate attorney Lewis Powell sparked a political rebellion with his call to arms for Corporate America. Like a gripping detective story, Smith follows the trail through to present day.  Chronicling a stunning shift in power, away from a healthy growing middle-class, toward a superPACed, lobbyist fueled, special interest driven, well oiled, corporate powered, political machine.

Over the past decade, at the center of the machine, stands the “Gang of Six” and Washington insider Dirk Van Dongen, the man behind the curtain, who coordinates very effective lobbying of our elected officials.  The Gang of Six include the U.S. Chamber of Commerce, the Business Roundtable, the National Association of Manufacturers, the National Federation of Independent Business, the National Restaurant Association, and Van Dongen’s own National Association of Wholesaler-Distributors.

Who Stole the American Dream? makes for compelling reading, and at the end, Smith offers up a grassroots-centered strategy for reclaiming the dream – restoring balance to our economy and re-building a healthy middle-class.  The video above will give you a summary understanding of what is well detailed in his book.

Corporate lobbyists funnel billions of dollars to our elected officials each year. Recent studies show that for every dollar spent lobbying, business receives over $220 back in legislation that favors the business.

On climate change alone, 770 companies hired 2,340 lobbyists, up 300% in past 5 years. Most of those companies have vested interests in fossil fuels and benefit from delay of legislation that would speed the transition to clean energy.

In 2011 private companies and special interest groups spent $3.32 billion lobbying their agendas. In 2010, they spent even more at $3.54 billion. From 2008 to 2010, 30 Fortune 500 companies spent more money on lobbying than they did on taxes.

In an unusual moment of candor, here’s what Senator Dick Durbin had to say about corporate money and politicians:

I think most Americans would be shocked, not surprised, but shocked if they knew how much time a United States Senator spends raising money.
And how much time we spend talking about raising money, and thinking about raising money, and planning to raise money.” Dick Durbin, 30 March 2012

Depending on status and influence, our elected officials in Congress typically raise about $5,000 to $30,000 per day. They spend a good part of each day dialing for dollars, asking businesses to send them money.  It is against the law (the Hatch Act) to make those calls from government property, so they walk to call centers located conveniently just a few minutes from Capitol Hill.

Money in Politics

For more on how corporations and our elected officials are joined at the hip, see the excellent series on Money in Politics.  Here’s an excerpt from that series:

So senators and congressmen go across the street to private rooms in nongovernmental buildings, where they make call after call, asking people for money.
In other words, most of our lawmakers are moonlighting as telemarketers.

“If you walked in there, you would say, ‘Boy, this is the about the worst looking, most abusive looking call center situation I’ve seen in my life,'” says Rep. Peter Defazio, a Democrat from Oregon. “These people don’t have any workspace, the other person is virtually touching them.”

There are stacks of names in front of each lawmaker. They go through the list, making calls and asking people for money.

The fundraising never stops, because everyone needs money to run for re-election. In the House, the candidate with more money wins in 9 out of 10 races, according to the Center for Responsive Politics, a nonpartisan group that tracks money in politics. In the Senate, it’s 8 out of 10.

It’s not uncommon for congressmen to average three or four hours moonlighting as telemarketers. One lawmaker told me if it was the end of the quarter and he really needed to make his numbers, he’d be there all day long.

The fox is in the hen house.  Time to get the big money out of politics. Surely our elected representatives don’t want to do this demeaning begging for money. Surely they would like to start making laws and setting public policy based on the merits of an issue. Right?

Recommended Reading

Who Stole the American Dream? by Hedrick Smith

When Does the Wealth of a Nation Hurt its Wellbeing? by Jay Kimball

Income Inequality: A Congressional Report Card by Jay Kimball

Money in Politics part of the NPR Planet Money series

Fair Elections Now Act is legislation to get big money out of Federal elections and replace it with grassroots public funding.  More details here and here.
 

Wind Power In Iowa: The New Super Crop

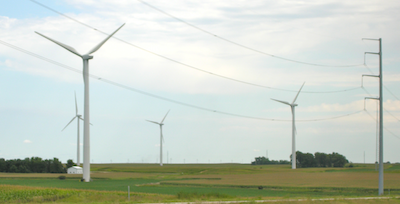
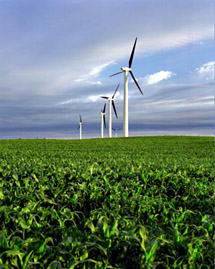
I am on a road trip across America, interviewing sustainable business leaders for a new book I am working on. Entering Iowa from the Northwest corner, hundreds of wind turbines rise majestically from the endless corn and soybean fields that are a staple of the Iowa landscape.

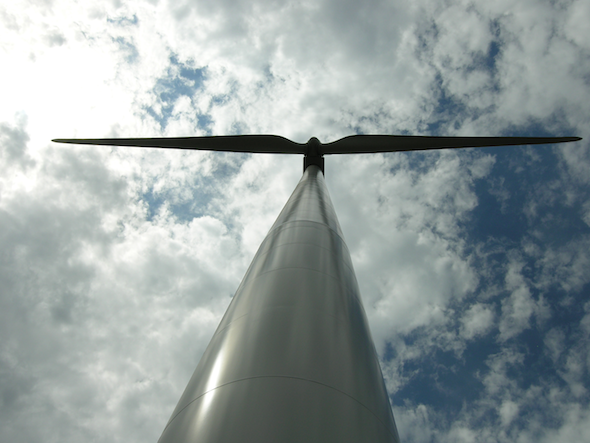
GE wind turbine and clouds

GE wind turbine in corn fieldPulling into an access road, I drive up to a newly installed wind turbine that looks like it is ready to be commissioned. It is a GE 1.6 megawatt (MW) wind turbine. The GE on-site engineer has obvious pride as he describes the wind turbine specs, design, and geology of the area that makes this site so amenable to wind power generation.

This wind turbine is located on the Coteau des Prairies, sometimes referred to as Buffalo Ridge. The ridge is composed of thick glacial deposits that gently rise to about 900 feet, from the surrounding prairie flatlands.  The ridge runs eastward, from eastern South Dakota, through southwestern Minnesota, and northwestern Iowa. Numerous wind farms have been built along the ridge to take advantage of the high average wind speeds.

Iowa wind power accounts for about 20% of the electricity generated in the state – about 4 billion watts of power (4 GW). Iowa leads the US in percentage of electrical power generated by wind. Wind turbines will produce from 12 to 16 times more revenue per acre than corn or soybeans. And farmers can plant crops around the wind turbine, reaping the benefits of both. In addition, in the winter, winds are stronger, generating much needed revenue while the fields lay fallow.

GE wind turbine and power lines

Coincidentally, I saw this news today, about farmers in the UK ramping up their investment in renewable energy:

More than one third of UK farmers want to install renewable energy projects on their farmland, most of them within the next year, and hope to generate average returns of 25,000 pounds ($40,565) per year, UK bank Barclays said.

The bank’s business arm on Tuesday launched a 100-million pound fund to help farmers finance renewable energy projects, including solar panels, wind farms, hydro plants and organic waste power as a growing number of agricultural businesses seek to benefit from government support tariffs.

We want to signal very clearly to the market that we consider this to be a big future industry, a big opportunity for agricultural businesses and also a big opportunity for the renewables,” said Barclays Business’ Product and Marketing Director, Travers Clarke-Walker, whose team will be managing the fund.

This is a quickly emerging industry.

A Barclays survey of 300 agricultural customers also showed four out of five farmers recognize renewable energy can save costs and 60 percent see it as a source of additional income.

The use of renewable energy on farmland has been brought to public attention in Britain by Michael Eavis, farmer and founder of the Glastonbury music festival, who installed over one thousand solar panels on his land.

The cost of installing renewable energy projects can be recovered after around 10 years, Clarke-Walker said.

The UK government slashed state support for large-scale solar plants earlier this month as it was concerned a few huge commercial projects would scoop up money intended for household and community projects.

Nevertheless, Clarke-Walker expects around 80-90 percent of projects will be solar and wind farms as they are cheapest to build and their costs are forecast to drop by up to 50 percent in the next three to five years as demand rises and technology improves.

Britain aims to generate 15 percent of energy from renewable sources by 2020, compared with 7.4 percent reached in 2010.

The fund’s loan budget is unlimited and the first 100 million pounds could support well over 100 projects as the average cost varies between 250,000-700,000 pounds, Clarke-Walker said.

Suffolk-based farmer Mike Porter, who plants crops such as wheat and oil seed rape, received a 130,000 pound loan from Barclays to install solar panels on a grain store last month and is expected to make 20,000 pounds per year by exporting power to the national grid.

Recommended Reading

Farming Wind Versus Farming Corn by Jay Kimball

20% Wind Energy by 2030 – Increasing Wind Energy’s Contribution to U.S. Electricity Supply by US Department of Energy (DOE)

Solar is the Fastest-Growing Industry in the US

solar statistics 2011 Q1Some good jobs news: “Solar is the fastest-growing industry in the US” according to Rhone Resch, President of  The Solar Energy Industries Association (SEIA), during his remarks accompanying release of the quarterly report “US Solar Market Insight.”  The report was jointly prepared and released by SEIA and Greentech Media (GTM).

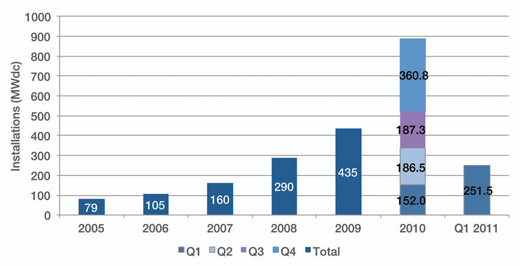
The graphic at right summarizes the stunning growth of the solar industry. Here are highlights from the report:

Solar Driving Jobs Creation

Rhone Resch said that the solar industry employs 100,000 Americans and that that number could double in the next two years. Within a few years, the US will be the world’s largest solar market, according to SEIA.

While California, New Jersey, and Arizona remained the top three states for solar installations, Pennsylvania jumped to the number 4 position, from number 8 in the rank last year. Maryland made the biggest move from 16th to 8th in the ranks.

Solar Growing Fast

Solar electric installations surpassed one gigawatt for the first time, and the US shows signs of being one of the top, if not the top global market for solar in the coming years. New solar photovoltaic (PV) installations for Q1 2011 grew 66% over Q1 2010. Total growth of the US solar market was up 67% in 2010, over 2009.

Solar industry manufacturing growth exceeded 31%, compared to less than 4% for overall manufacturing in the US in 2010.

Solar Pricing Continues To Improve

In Q1 2011 for the solar industry, jobs were up, installations were way up for PV and Concentrated Solar Power (CSP), manufacturing growth was up and prices are coming down. Solar system pricing is down 15 percent from Q1 2010.

While fossil fuels continue getting more and more expensive and extraction of oil, gas and coal becomes more and more toxic, the much cleaner renewable energy sector, including the solar industry, pricing is getting cheaper and cheaper.

Key Details

Photovoltaics (PV):

  • Grid-connected PV installations in Q1 2011 grew 66% over Q1 2010 to reach 252 MW.
  • Cumulative grid-connected PV in the U.S. has now reached over 2.3 GW.
  • Cumulative grid-connected solar electric (PV and CSP) has now reached 2.85 GW.
  • The top seven states installed 88% of all PV in Q1 2011, up from 82% in 2010.
  • Commercial installations in Q1 2011 more than doubled over Q1 2010 in 10 of the top 21 states.
  • U.S. module production increased by 17% relative to Q4 2010, from 297 MW to 348 MW. While production from export-oriented firms and facilities dipped materially because of soft demand in the key feed-in tariff markets of Germany and Italy, plants that serve the domestic market enjoyed far healthier utilization of manufacturing capacity.
  • After a year of flat-to-increased pricing for some PV components in 2010, annual beginning-of-year feed-in tariff cuts and depressed global demand in Q1 2011 resulted in substantial price declines. Wafer and cell prices dropped by around 15% each, while module prices fell around 7%.

Concentrating Solar Power (CSP):

  • The 500-MW Blythe CSP plant obtained a $2.1 billion DOE loan guarantee.
  • Construction is underway on the-30 MW Alamosa CPV plant, with expected completion in 2011.
  • There is a concentrating solar (combined CSP and CPV) pipeline of over 9 GW in the U.S.; more than 2.4 GW have signed power purchase agreements.
  • In total, 1,100 MW of CSP and CPV are now under construction in the U.S.

All Solar Markets:

  • The total value of US solar market installations grew 67 percent from $3.6 billion in 2009 to $6.0 billion in 2010.
  • Solar electric installations in 2010 totaled 956 megawatts (MW) to reach a cumulative installed capacity of 2.6 gigawatts (GW), enough to power more than half a million households.

Solar PV installations continue their exponential growth.

US PV Installations
US PV Installations 2005 through Q1 2011

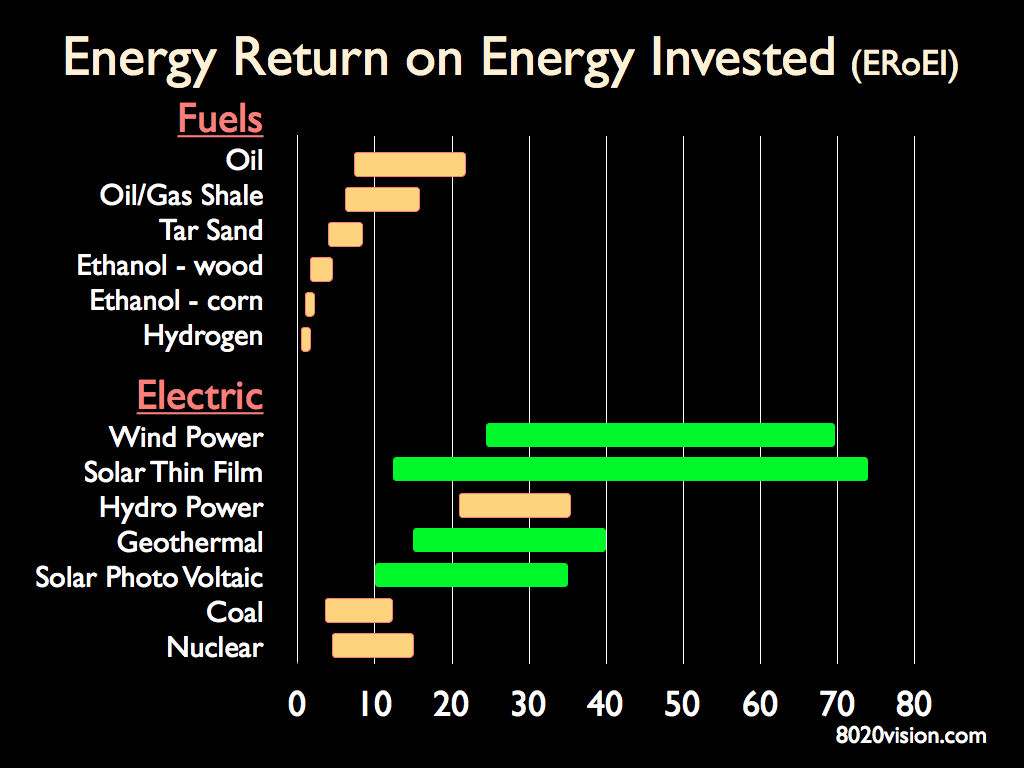
The extraordinary growth of solar makes sense. Think of sunlight as free oil. It’s all around us every day, available for collection. No need for drilling and no threat of oil spills or toxic emissions. Solar panels convert the free energy into electricity or heat. And they do it with remarkable efficiency. It takes energy to produce energy, and to my mind, one of the most important ways to measure the energy performance of something is by calculating the Energy Returned on Energy Invested (ERoEI) – which measures how much energy it takes to produce the energy. The higher the ERoEI, the better. Here’s a chart showing the ERoEI for various energy sources.

ERoEI


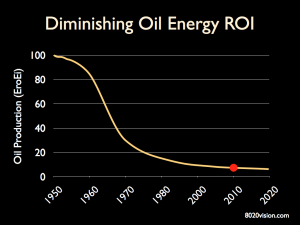
Oil ERoEI TrendSolar and wind have the highest ERoEI of all sources of energy, and they are trending higher. Meanwhile, looking at oil, the easy oil has been extracted, what remains is increasingly expensive and difficult to get to, and toxic to extract and process. It takes much more energy to produce a barrel of oil today than it did just 50 years ago. Oil’s ERoEI has plummeted from about 100:1 in the 1950’s to about 10:1 today.

In the US Energy Information Administration’s most recent Monthly Energy Review, they show that domestic production of renewable energy has surpassed that of nuclear power.

During the first quarter of 2011, renewable energy sources (note that this includes biomass/biofuels, geothermal, solar, water, wind):

  • Provided 11.73 percent of U.S. energy production.
  • Delivered 5.65 percent more than that from nuclear power.
  • Energy from renewable sources is now 77.15 percent of that from domestic crude oil production.

Looking at just the electricity sector, according to the latest issue of EIA’s Electric Power Monthly, for the first quarter of 2011, renewable energy sources (biomass, geothermal, solar, water, wind) accounted for 12.94 percent of net U.S. electrical generation — up from 10.31 percent during the same period in 2010.

In terms of actual production, renewable electrical output increased by 25.82 percent in the first three months of 2011 compared to the first quarter of 2010. Solar-generated electricity increased by 104.8 percent, wind-generated electricity rose by 40.3 percent, hydropower output expanded by 28.7 percent, and geothermal electrical generation rose by 5.8 percent. Only electricity from biomass sources dropped, by 4.8 percent. By comparison, natural gas electrical output rose by 1.8 percent and nuclear-generated electricity increased by only 0.4 percent, while coal-generated electricity dropped by 5.7 percent.

The chart below is a concise view of the energy flow from various energy sources and destinations. Though it is only current through 2009, it gives a remarkable view into the complex landscape of where our energy comes from and how we use it.

eia energy flow 2009
(source: EIA)

U.S. Solar Market InsightTM Background Materials:

Executive Summary

Details on the reports

The U.S. Solar Market Insight: Year-in-Review 2010

June 16 Press Conference

The Q2 2011 edition of US Solar Market Insight will be available in September 2011.

Other Background Materials:

2010 National Solar Jobs Census

Details on the solar energy companies operating in each state, plus examples of the jobs being created

US Solar Energy Trade Assessment 2010 report finds the US is a net exporter of solar products

Major Solar Projects list


While Congress Dithers, U.S. Military Speeds Transition to Alternative Energy

The most read article at the NY Times online yesterday was The U.S.S. Prius by Thomas Friedman. The thrust of the article centers around two brutal facts – we are fighting wars for oil, and wars consume a lot of oil. One of the tidbits mentioned toward the end of the article is that a gallon of gas costs up to $400 per gallon by the time it reaches the front lines. Moving beyond the economics, getting fuel to the front lines also costs lives. The U.S. military loses one soldier for every 24 fuel convoys it runs in Afghanistan.

Friedman observes “at a time when a fraudulent, anti-science campaign funded largely by Big Oil and Big Coal has blocked Congress from passing any clean energy/climate bill” the U.S. Navy and Marines are spearheading a strategy to make the military much more energy efficient. Friedman adds, “Unlike the Congress, which can be bought off by Big Oil and Big Coal, it is not so easy to tell the Marines that they can’t buy the solar power that could save lives.

Ray Mabus, the Secretary of the Navy, has crafted a strategy to shift from oil to alternative energy, including, solar and biofuels. On Earth Day this year, the Navy flew a F/A-18 Super Hornet fighter jet powered by a 50-50 blend of conventional jet fuel and camelina aviation biofuel made from pressed mustard seeds.

And while congress favors boondogles like corn ethanol, which uses almost as much energy producing it as it yields:

The Navy will use only “third generation” biofuels. That means no ethanol made from corn because it doesn’t have enough energy density. The Navy is only testing fuels like camelina and algae that do not compete with food, that have a total end-to-end carbon footprint cleaner than fossil fuels and that can be grown in ways that will ultimately be cheaper than fossil fuels.

Mabus has also set a goal for the Navy to use alternative energy sources to provide 50 percent of the energy for all its war-fighting ships, planes, vehicles and shore installations by 2020.

About 60% of the oil we consume is imported from foreign nations – many of those nations are petro-dictatorships. As we shift to alternative fuels and energy, we can reduce our dependance on foreign oil.

camelina oil bio-fuel
Camelina Sativa

Though many people are familiar with solar energy, innovations in the field of biofuels are less well known. Most vehicles run on liquid fossil fuels – gasoline and diesel. Biofuels, such as camelina, provide a cleaner greener alternative to fossil fuels. Camelina Sativa is a member of the mustard family, a distant relative to canola. Camelina can grow on land unsuitable for most food crops, especially arid lands. It has yields that are roughly double that of soy. Camelina can be grown in a rotation with wheat crops. Farmers who have followed a wheat-fallow pattern can switch to a wheat-camelina-wheat pattern, and produce up to 100 gallons of camelina oil per acre, while growing up to 15 percent more wheat. And once the oil is pressed from the seed, the leftover “mash” can be used as nutritious livestock feed.

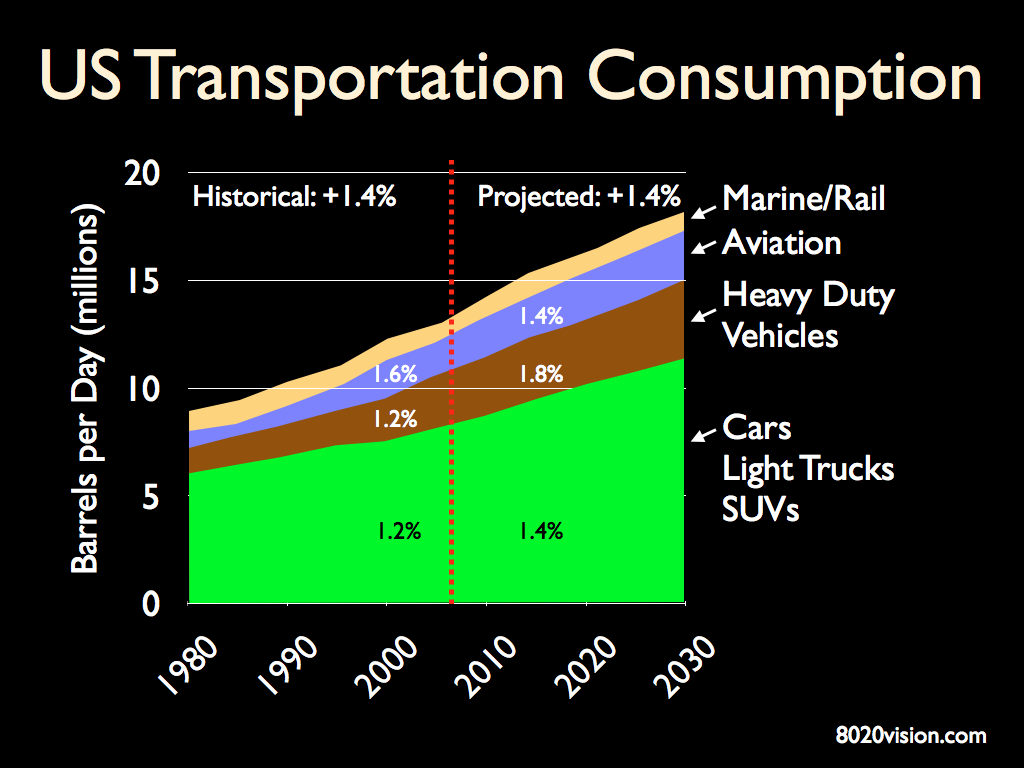
We consume more oil for transportation than anything else. Innovations in transportation fuels will have the most impact on global energy consumption and associated emissions of climate-changing CO2.

US Oil Consumption Transportation
(source:DOE)

Oil production is peaking and will become increasingly expensive. It’s time to support our transition to a cleaner, greener alternative energy.

Peak Oil

The U.S. spends more money on potato chips than energy research and development. To restore US scientific and technical leadership, Congress needs to stop bashing science and taking money from Big Oil, and start investing in our energy future.

Recommended Reading

GOP Rep. Bob Inglis On Climate Change by Jay Kimball

Camelina Oil by Sustainable Oils

Top Business Leaders Deliver Clean Energy Plan by Jay Kimball

German Military Study Warns of Potential Energy Crisis by Jay Kimball

Department of Defense Perspectives on Climate Change and Peak Oil

Prosperity Without Growth

Keywords: smart growth, sustainable growth, sustainable business, Edward D. Hess, Strategy+Business

In the latest issue of Strategy and Business, David K. Hurst reviews Smart Growth by Edward D. Hess. The review is below. For more on growth and sustainability see:

Nobel Laureate Joseph Stiglitz on Sustainability and Growth

Prosperity without Growth: A review of Smart Growth by Edward D. Hess

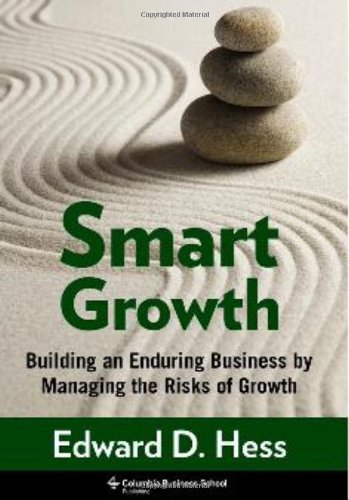
Edward D. Hess, professor of business administration and Batten Executive-in-Residence at the University of Virginia’s Darden School of Business, has a heretical thought: Growth may not be good. In Smart Growth, he questions the four major assumptions behind the conventional wisdom of corporate success, which he calls the “growth mental model” (GMM): that businesses must grow or die, that growth is unequivocally good, that growth should be smooth and continuous, and that quarterly earnings are the primary measure of success. In addition, he supplies a series of trenchant questions for managers to ask themselves about how, why, and even whether their firms should grow.

In nine crisp chapters, Hess demonstrates that the GMM is neither possible in practice nor feasible in theory, and that attempts to meet its demands can create insurmountable obstacles to corporate sustainability. His arguments are supported by a series of case studies showing that growth is usually uneven and episodic — impossible to sustain for more than relatively short periods of time. Thus, attempts to “implement” the GMM result either in profitless growth, especially through acquisitions, or in ersatz earnings produced via a wide variety of financial manipulations. To test whether the concept of the GMM is supported by theoretical perspectives on growth, Hess turns to economics, organizational strategy and design, and biology. He finds that neoclassical economics is the framework that is most sympathetic to the GMM, but its assumptions do not hold up in the real world; that the strategic and design perspective offers little support for the GMM; and that biological theories are notable for the stress they put on the limits to growth. So there is little support for the conventional wisdom in theory.

Hess’s conclusion is that corporations should aim for sustainable or “smart” growth by asking some key questions, especially regarding the resources most needed to support such growth. Following economist Edith Penrose’s resource-based theory of the firm, he contends that the true limit to growth is usually defined by the capabilities of the firm’s managers — supporting this argument with the well-documented case of Starbucks’s overreach, in which the rapid expansion in the number of stores caused liabilities to rise precipitously and diluted the value of the brand.

All this makes good sense. The only shortcoming may be the author’s failure to examine why the GMM is so robust in the face of all the evidence against it. Is it because there are large constituencies in the economy that generate revenue by pushing the GMM and thriving on the turmoil it creates? If so, is there a need for public policy addressing it? And what risks do firms run if they eschew the flawed GMM in favor of smart growth?

Author Profile:

David K. Hurst is a contributing editor of strategy+business. His writing has also appeared in the Harvard Business Review, the Financial Times, and other leading business publications. Hurst is the author of Crisis & Renewal: Meeting the Challenge of Organizational Change (Harvard Business School Press, 2002).

Reprinted with permission from the strategy+business website. Copyright 2010 by Booz & Company. All rights reserved. www.strategy-business.com

More on Smart Growth at Amazon.com

Farming Wind Versus Farming Corn for Energy

keywords: wind power, wind turbines, corn ethanol, ERoEI

corn field with wind turbines
Farmers can plant crops right to the base of wind turbines (photo: Warren Gretzl, NREL)

If a farmer has 1,000 acres of land, and he/she planted it with corn for making ethanol and erected wind turbines for generating electricity, how much energy will the farmer produce and what are the economics?

Wind Power

A typical wind farm will have about 15 wind turbines per 1,00o acres. Each wind turbine will generate about 500 kW of power (assuming 33% capacity factor). Electricity retails at about 12¢ per kW hour. So 1,000 acres will produce 15 x 500 x .12 = $900 of electricity per hour, which equates to about $8,000,000 per year, representing about 224 trillion BTUs of energy.

Corn Ethanol Power

A typical 1,000 acre corn farm will produce about 7,500 pounds of corn, yielding about 340,000 gallons of ethanol. Ethanol retails at about $1.80 per gallon. So 1,000 acres will produce 340,000 x 1.8 = $612,000 per year, representing about 26 billion BTUs of energy.

Energy Returned on Energy Invested

It takes energy to produce energy. The Energy Returned on Energy Invested (ERoEI) for wind turbines is an impressive, state of the art wind turbines are providing ERoEI of over 50:1.

It takes a lot of energy to produce corn ethanol, which yields a far lower ERoEI of between .8 and 1.65 (see Ethanol’s Energy Return on Investment: A Survey of the Literature 1990-Present by Roel Hammerschlag).

ERoEI

Side-effects of Wind Power and Corn Ethanol Production

Wind turbines are often perceived as an eyesore, marring the land with imposing manmade structures. Flying creatures such as hawks and bats are often killed as they pass through the turbine blades. Wind turbines are noisy, and are best located in rural areas, or at sea. Wind power needs to be located near power transmission resources, it that infrastructure will need to be built.

Corn ethanol yields just a bit more energy than it takes to produce it. It takes about 1,700 gallons of water to produce each gallon of corn ethanol. Corn used for ethanol production is corn not used for food production. As food corn supply is reduced, corn-based food prices rise.

Summary

Given 1,000 acres of land, planted with corn and a typical density of wind turbines, the table below summarizes the annual economic and energy value of corn ethanol fuel and wind turbine electricity.

Wind Power Corn Ethanol
Retail Value $8,000,000 $612,000
Energy Yield 224 trillion BTUs 26 billion BTUs
ERoEI 50:1 1.5:1