Hedrick Smith: Who Stole the American Dream?

Veteran investigative reporter and Pulitzer Prize winner Hedrick Smith’s new work, Who Stole the American Dream?, steps back from the partisan fever of the 2012 campaign to explain how we got to where we are today — how America moved from an era of middle class prosperity and power, effective bipartisanship, and grass roots activism, to today’s polarized gridlock, unequal democracy and unequal economy that has unraveled the American Dream for millions of middle class families.

On 22 September 2012, Hedrick Smith spoke at the Parish Hall on Orcas Island, WA, as part of the Crossroads Lecture Series. He spoke for about an hour, followed by a 20 minute question and answer session. His book is available on Orcas Island at Darvill’s Bookstore (a signed copy), or at Amazon.

Smith’s book is brimming with fascinating insider stories that detail the shift from  a strong middle class of the 50s and 60s, to the current weakened middle class, with an income inequality that is at an all time high, ranking with that of Rwanda and Uganda.

This didn’t happen by accident. Smith details how, beginning in the 1970s, corporate attorney Lewis Powell sparked a political rebellion with his call to arms for Corporate America. Like a gripping detective story, Smith follows the trail through to present day.  Chronicling a stunning shift in power, away from a healthy growing middle-class, toward a superPACed, lobbyist fueled, special interest driven, well oiled, corporate powered, political machine.

Over the past decade, at the center of the machine, stands the “Gang of Six” and Washington insider Dirk Van Dongen, the man behind the curtain, who coordinates very effective lobbying of our elected officials.  The Gang of Six include the U.S. Chamber of Commerce, the Business Roundtable, the National Association of Manufacturers, the National Federation of Independent Business, the National Restaurant Association, and Van Dongen’s own National Association of Wholesaler-Distributors.

Who Stole the American Dream? makes for compelling reading, and at the end, Smith offers up a grassroots-centered strategy for reclaiming the dream – restoring balance to our economy and re-building a healthy middle-class.  The video above will give you a summary understanding of what is well detailed in his book.

Corporate lobbyists funnel billions of dollars to our elected officials each year. Recent studies show that for every dollar spent lobbying, business receives over $220 back in legislation that favors the business.

On climate change alone, 770 companies hired 2,340 lobbyists, up 300% in past 5 years. Most of those companies have vested interests in fossil fuels and benefit from delay of legislation that would speed the transition to clean energy.

In 2011 private companies and special interest groups spent $3.32 billion lobbying their agendas. In 2010, they spent even more at $3.54 billion. From 2008 to 2010, 30 Fortune 500 companies spent more money on lobbying than they did on taxes.

In an unusual moment of candor, here’s what Senator Dick Durbin had to say about corporate money and politicians:

I think most Americans would be shocked, not surprised, but shocked if they knew how much time a United States Senator spends raising money.
And how much time we spend talking about raising money, and thinking about raising money, and planning to raise money.” Dick Durbin, 30 March 2012

Depending on status and influence, our elected officials in Congress typically raise about $5,000 to $30,000 per day. They spend a good part of each day dialing for dollars, asking businesses to send them money.  It is against the law (the Hatch Act) to make those calls from government property, so they walk to call centers located conveniently just a few minutes from Capitol Hill.

Money in Politics

For more on how corporations and our elected officials are joined at the hip, see the excellent series on Money in Politics.  Here’s an excerpt from that series:

So senators and congressmen go across the street to private rooms in nongovernmental buildings, where they make call after call, asking people for money.
In other words, most of our lawmakers are moonlighting as telemarketers.

“If you walked in there, you would say, ‘Boy, this is the about the worst looking, most abusive looking call center situation I’ve seen in my life,'” says Rep. Peter Defazio, a Democrat from Oregon. “These people don’t have any workspace, the other person is virtually touching them.”

There are stacks of names in front of each lawmaker. They go through the list, making calls and asking people for money.

The fundraising never stops, because everyone needs money to run for re-election. In the House, the candidate with more money wins in 9 out of 10 races, according to the Center for Responsive Politics, a nonpartisan group that tracks money in politics. In the Senate, it’s 8 out of 10.

It’s not uncommon for congressmen to average three or four hours moonlighting as telemarketers. One lawmaker told me if it was the end of the quarter and he really needed to make his numbers, he’d be there all day long.

The fox is in the hen house.  Time to get the big money out of politics. Surely our elected representatives don’t want to do this demeaning begging for money. Surely they would like to start making laws and setting public policy based on the merits of an issue. Right?

Recommended Reading

Who Stole the American Dream? by Hedrick Smith

When Does the Wealth of a Nation Hurt its Wellbeing? by Jay Kimball

Income Inequality: A Congressional Report Card by Jay Kimball

Money in Politics part of the NPR Planet Money series

Fair Elections Now Act is legislation to get big money out of Federal elections and replace it with grassroots public funding.  More details here and here.
 

What feeds a revolution?

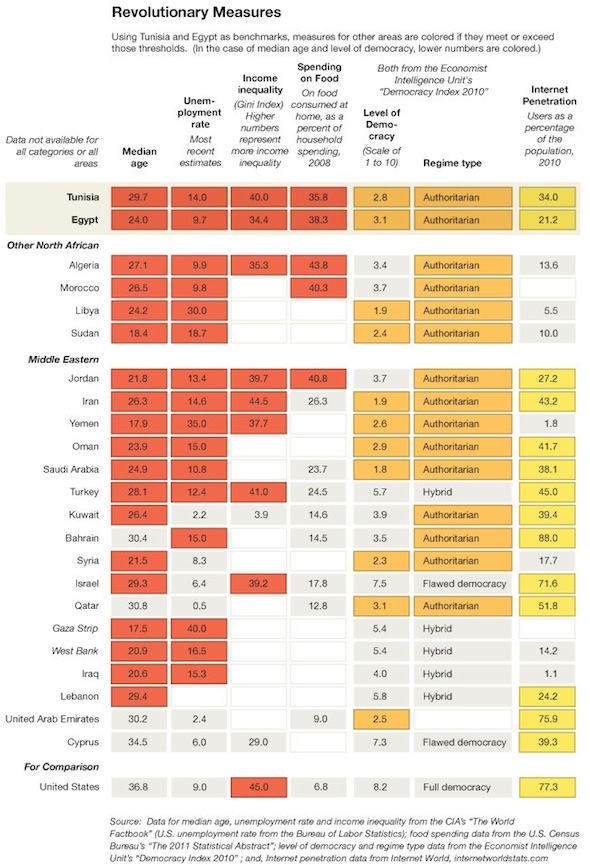
Charles M. Blow, one of my favorite “number crunchers”, and op-ed columnist at the NY Times, has a good article today on what causes a revolution. He turns the lens on Egypt and Tunisia, as well as other countries that might be poised for revolution, and looks at what factors can contribute to people rising up and overthrowing their government.

Though agitating factors like unemployment and age have featured in many articles on the situation in Egypt and Tunisia, Charles M. Blow digs deeper. He prepared the table below, which shows median age, unemployment rate, income inequality, food as a percentage household spending, level of democracy, regime type, and internet penetration.

revolution egypt tunisia food income inequality internet penetration, regimeWorth noting: The real US unemployment rate is about 16%, when considering the more comprehensive U6 Rate. The US has the highest income inequality of all the countries considered in the list above. The US ranks with Rwanda and Uganda.  For more on that, see the recent 8020 Vision article When Does the Wealth of a Nation Hurt its Wellbeing?

I am glad Blow listed food as one of the metrics to consider. There is a proverb that governments ignore at their peril:

“Lo que separa la civilización de la anarquía son solo siete comidas.”
(Civilization and anarchy are only seven meals apart.)

—Spanish proverb

Though Egypt is not unique – corrupt repressive governance and cronyism can be found at the heart of many dysfunctional nations – once corruption interferes with meeting the basic needs of the populace, revolution is imminent.

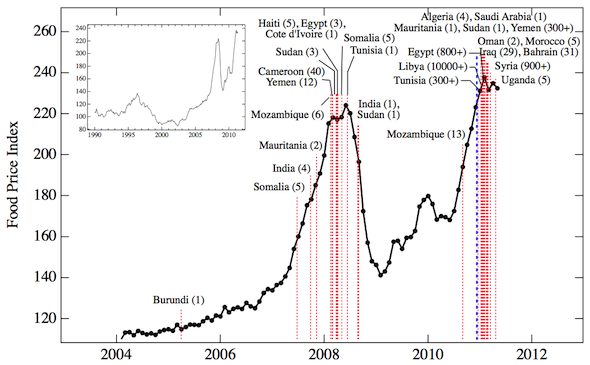
food price correlation with food riots
Time dependence of FAO Food Price Index from January 2004 to May 2011. Red dashed vertical lines correspond to beginning dates of “food riots” and protests associated with the major recent unrest in North Africa and the Middle East. The overall death toll is reported in parentheses. Blue vertical line indicates the date, December 13, 2010, on which author submitted a report to the U.S. government, warning of the link between food prices, social unrest and political instability. Inset shows FAO Food Price Index from 1990 to 2011. (Source: The Food Crises and Political Instability in North Africa and the Middle East, New England Complex Systems Institute)

The Basics Of Revolution

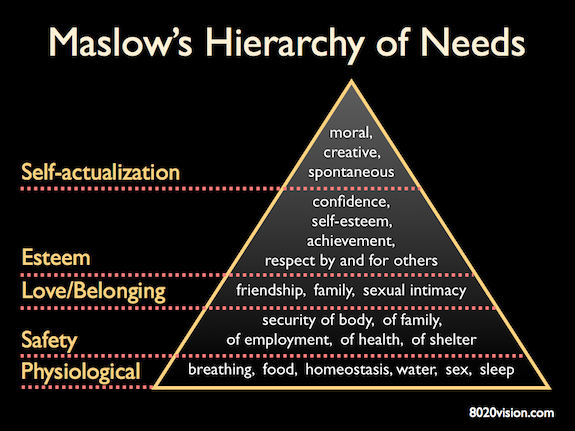
When I work with clients and this subject comes up, I like to turn to Maslow’s hierarchy of needs to put this in perspective. As we can see, two of Charles Blow’s metrics – food and unemployment – are fundamental components of basic human needs.

Maslow's hierarchy of needs

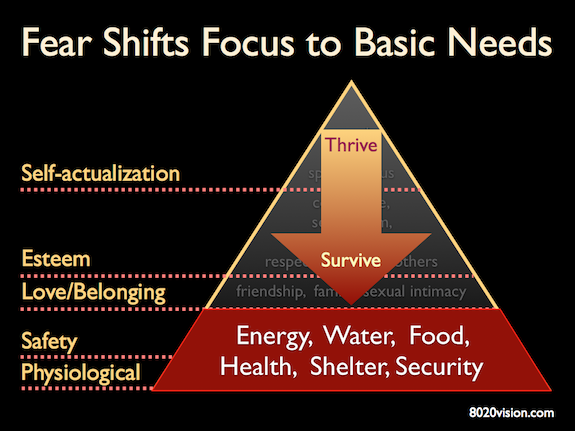
The lower down on Maslow’s pyramid a dysfunctional regime effects the populace, the deeper the impact, and the more likely the effected people will rebel. In other words, when a government fails to meet the basic human needs of its people, the people rise up.

Maslow's hierarchy of needs - basic needs

Looking back in history for examples of how food and government are connected at the hip, our eyes come to rest on the Roman empire. Though the causes of the fall of Rome are debated still, one thing is certain: As the Roman empire devolved into the late-stage “Bread and Circuses” phase, once the farm system failed and the bread ran out, the rulers quickly lost the support of the people. The party was over.

the fall of Rome by
The Fall of Rome by Thomas Cole

The party is over in Egypt. President Mubarak now requires plainclothes thugs with clubs to beat back the public, losing what little credibility and dignity he might have had. How will he sleep? I don’t think the prideful Mubarak’s $60 billion family bank account will numb the shame he must feel as he watches the Egyptian army protect the people from his secret police.

As Tunisia and Egypt fail, Charles M. Blow scans his table of cold hard data and asks “Who’s next?”

Seen through that prism (of food, income inequality, and internet penetration), Tunisia and Egypt look a lot alike, and Algeria, Iran, Jordan, Morocco and Yemen look ominously similar.

A Global Perspective on Food

Pulling the lens back for a more global view – as world population expands inexorably – we are approaching a tipping point with regard to food production.

This week, a report that gained little attention in the news, but has major ramifications for every nation – especially those where food is a larger percentage of household income – was published by the UN’s Food and Agriculture Organization (FAO).

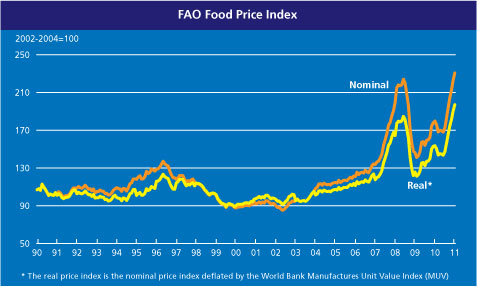
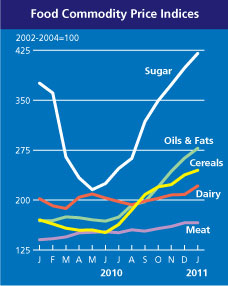
The FAO report – The World Food Situation – reports that world food prices surged to a new historic peak in January, for the seventh consecutive month. The FAO Food Price Index (below) is a commodity basket that regularly tracks monthly changes in global food prices.

This is the highest level (both in real and nominal terms) since FAO started measuring food prices in 1990.

FAO Food and Agriculture Organization food price index 2010

FAO food price commodity index 2010As we can see from the chart on the right, the price of individual commodities that comprise the index – meat, dairy, cereals, oil and fats, and sugar – are all on the rise.

Global food prices have exceeded their pre-recession price levels. Some of this is due to the price of petroleum returning to pre-recession levels. About 17% of all petroleum production is consumed for food production. Petroleum is a key ingredient in the manufacture of fertilizer and pesticides, and sources energy for irrigation, food transport, etc. Note how the Food Price Index closely parallels the price of oil.

In addition, climate change is driving an increase in extreme weather, including record heat during growing seasons, record flooding, and extreme rain.

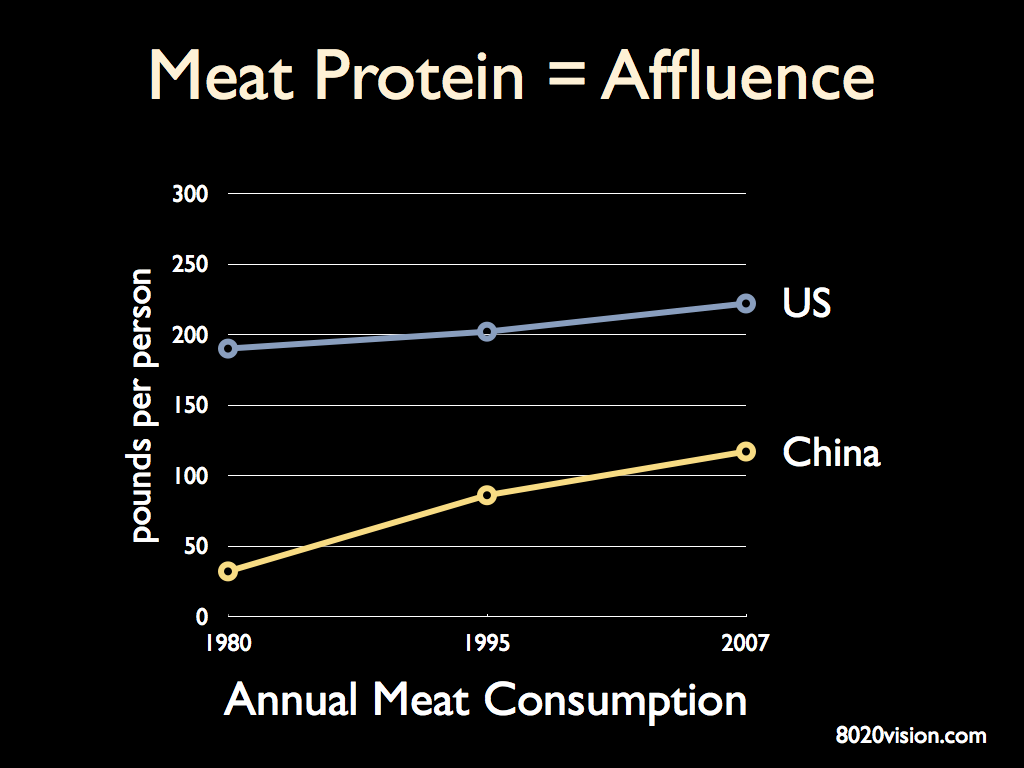
And as nations move up the affluence curve, their consumption of food increases, creating rising demand from a limited supply. As Julian Cribb, author of The Coming Famine: The Global Food Crisis and What We Can Do to Avoid It, astutely points out – as developing nations become more affluent, they consume more protein, in the form of fish, meat, milk, eggs, etc. For an example from China, read the article that appeared in The Financial Times today: Chinese Corn Imports Forecast to Soar. Note the mention of corn for meat production.

Meat Protein Consumption in US and China
(source: US Department of Agriculture)

Protein is usually produced with grain, and it is an inefficient process:

  • It takes 1,ooo tons of water to produce a ton of grain
  • It takes about 15 pounds of grain to produce a pound of beef
  • So, it takes about 5,200 gallons of water to produce a pound of beef

As our population increases, and as each nation seeks affluence, food will become a major factor in the stability of all nations, not just the rotting authoritarian regimes of the world.

egypt revolution

Related Articles

Why Farmers Need a Pay Rise…

Climate Change May Reduce Protein in Crops

Recommended Reading: The Coming Famine

Chinese corn imports forecast to soar

Feebates

Keywords: Feebate, Art Rosenfeld, RMI, reducing automobile CO2 emissions, reducing oil addiction

Feebates offer a compelling approach to curbing automobile fuel consumption and CO2 emissions. The concept was pioneered in the 1970s by Jonathan Koomey and Art Rosenfeld (Lawrence Berkeley National Laboratory) and is finding renewed interest around the world.

Feebates are market-based policies for encouraging emissions reductions from new passenger vehicles by levying fees on relatively high-emitting vehicles, and using those collected fees to provide rebates to lower-emitting vehicles.

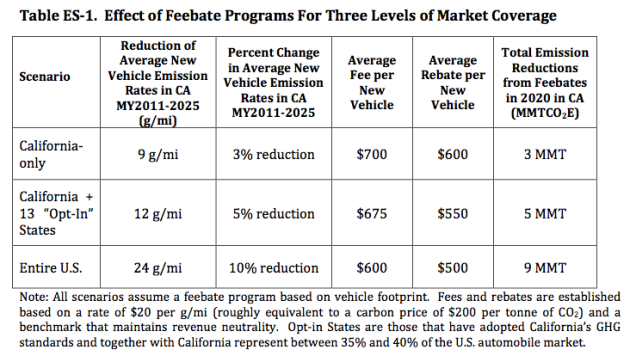
California is considering adopting a Feebate program. The UC Davis Institute of Transportation Studies recently published their analysis of a Feebate program – Potential Design, Implementation, and Benefits of a Feebate Program for New Passenger Vehicles in California. The report provides a detailed overview and analysis of Feebates and reviews Feebate programs already underway in other countries.

California Feebate UC Davis
(source: UC Davis Institute of Transportation Studies)

Rocky Mountain Institute has a good review of the Feebate approach to reducing oil consumption.

Highlights of RMI’s report Feebates: A Key to Breaking U.S. Oil Addiction

  • The scale of U.S. oil consumption (nearly 19 million barrels per day) combined with its virtual monopoly of transportation energy (97 percent oil-based), creates strategic weakness, economic insecurity, widespread health hazards, and environmental degradation.
  • Feebate is an innovative policy that greatly speeds the development and deployment of efficient vehicles.
  • The California Legislature actually approved a similar “Drive+” law by an astonishing seven-to-one margin in 1980, but Governor George Deukmejian pocket-vetoed it after a mixed initial reaction from automakers, and it’s been bottled up ever since.

The basic idea of a feebate is simple. Buyers of inefficient vehicles are levied a surcharge (the “fee”), while buyers of efficient vehicles are awarded a rebate (the “bate”). By affecting the purchase cost up front, feebates speed the production and adoption of more efficient vehicles, saving oil, insecurity, cost, and carbon.

Though efficient vehicles’ reduced operating costs make them a good buy over the years, consumers’ implicit real discount rates, up to 60-plus percent per year (and nearly infinite for low-income car-buyers), make miles per gallon a relatively weak economic signal: long-term fuel savings are so heavily discounted that buyers, in effect, count just the first year or two—as minor an economic choice as whether to buy floor mats.

In contrast, feebates capture the life-cycle value of efficiency (or the cost of inefficiency) and reflect it in the sticker price. By increasing the price spread between less and more efficient vehicles, feebates bridge the gap between consumers’ and society’s perceptions of the time value of money. This corrects the biggest single obstacle to making and buying efficient vehicles.

Feebates can shift purchasing patterns in the short run and spur automakers’ innovation in the medium and long run. But to do both, a feebate program, like any well intentioned policy, must be properly designed and implemented. As RMI Principal Nathan Glasgow notes, “With feebates, the devil is really in the details.”

Feebate Forum
In 2007, RMI organized and hosted the first Feebate Forum, pulling together 27 experts from the auto and insurance industries, NGOs, academia, and government to discuss feebate design and implementation schemes. Through open dialogue, the group developed a set of design recommendations, barriers, and next steps for feebates.

The participants agreed on the following design goals:

1. Metrics should be based on fuel efficiency or greenhouse gas emissions, and all types of transportation energy can be included—not just diverse fuels but also electricity.

2. The size of the fee or rebate shouldn’t depend on vehicle size. The feebate should reward buyers for choosing a more efficient model of the size they want, not for shifting size. A size-class-based feebate preserves the competitive position of each automaker regardless of its offerings, debunks the myth that consumers must choose between size and efficiency, and doesn’t restrict freedom of choice. Buyers can get the size they want; the efficiency of their choice within that size class determines whether they pay a fee or get a rebate, and how much.

3. Feebates should be implemented at the manufacturer level, so automakers, rather than a government agency, should pay the fees and collect the rebates. This lets manufacturers monitor results and adjust their vehicle mix accordingly, and it avoids any need for taxpayers to foot the bill for any costs. However, a good feebate program should be revenue-neutral, with “fees” paying for “bates” plus administrative costs—a potentially attractive feature. And since the “fees” are entirely avoidable by choice, they’re not a tax.

4. The “pivot point” between fees and rebates should be adjusted annually, so the program is trued up to stay revenue-neutral, and automakers have a predictable and continuous incentive to improve the efficiency of their offerings, spurring innovation.

5. Feebates should be designed for complete compatibility with efficiency or carbon-emissions standards, so automakers aren’t whipsawed between incompatible incentives or requirements. In practice, feebates may drive efficiency improvements much larger and faster than standards require, making the standards unimportant except to prevent recidivism.

France introduced the largest feebate program to date

  • Averaging 133 grams of carbon dioxide per kilometer for the 2009 new light-vehicle fleet, France’s vehicles now have the lowest carbon emissions in the European Union.
  • By comparison, the UK’s 2009 new vehicles emitted, and the EU average is, 146. Between 1995 and 2007 (when the French feebate was introduced at year-end), the emissions rate of new vehicles sold in France was falling at an average rate of 2.25 grams of carbon dioxide per kilometer per yearDuring the first two years of the feebate program, the annual emissions decrease more than tripled to 8 grams per kilometer. Overall, the efficient bonus vehicles’ market share nearly doubled, from 30 to 56 percent, while the inefficient malus vehicles’ share fell threefold, from 24 to 8 percent.

The French program was not size-neutral as RMI recommends for the U.S., and the data show it shifted new-car buyers toward smaller vehicles. The market share of the smallest (economy) cars grew from 44 percent in 2007 to 57 percent in 2009, much as we’d expect for such a fleetwide feebate structure: smaller vehicles tend to have higher efficiency and lower carbon emissions, so unless unusually inefficient, they’ll earn a rebate that’s attractive to many buyers. For the U.S., RMI recommends a size-neutral feebate design to shift the entire market toward lighter, more aerodynamic, and advanced-powertrain vehicles, not just smaller ones.

California is currently considering the introduction of a statewide feebate bill

  • A state program would probably do more to shift the in-state vehicle sales mix than to spur innovative design, since even a market as big as California represents only a fraction of the U.S. auto market. Nonetheless, RMI is following this program closely.
  • In 2008, California’s aggressiveness on fuel efficiency spurred higher national CAFE standards, and a number of other states follow California’s lead on Clean Air Act and related policies. States and regions can make fine laboratories for refining policy innovations that later guide uniform national policies.

Growth Versus Consumerism

Keywords: growth, consumption, GDP, global economy, China, India, consumerism

Robert Reich wrote a thoughtful article on Why Growth is Good. Highlights of the article are below. In it, he differentiates between growth and consumption.

Growth is really about the capacity of a nation to produce everything that’s wanted and needed by its inhabitants. That includes better stewardship of the environment as well as improved public health and better schools.

A couple years ago I wrote an article – Nobel Laureate Joseph Stiglitz on Sustainability and Growth – in which Stiglitz talked about the idea that “we grow what we measure.” Here’s an exerpt from the end of that article that I think is relevant to Reich’s article:

For me, what Stiglitz is getting at is:  We grow what we measure (GDP), and because we are measuring the wrong stuff, we are growing wrong. It seems to be in our DNA to want to “grow,” but like a garden, don’t we have a choice about what we grow?  Are there ways we can grow our economy that restore abundance rather than consume it? What are the essential things to measure so that we are growing good things?

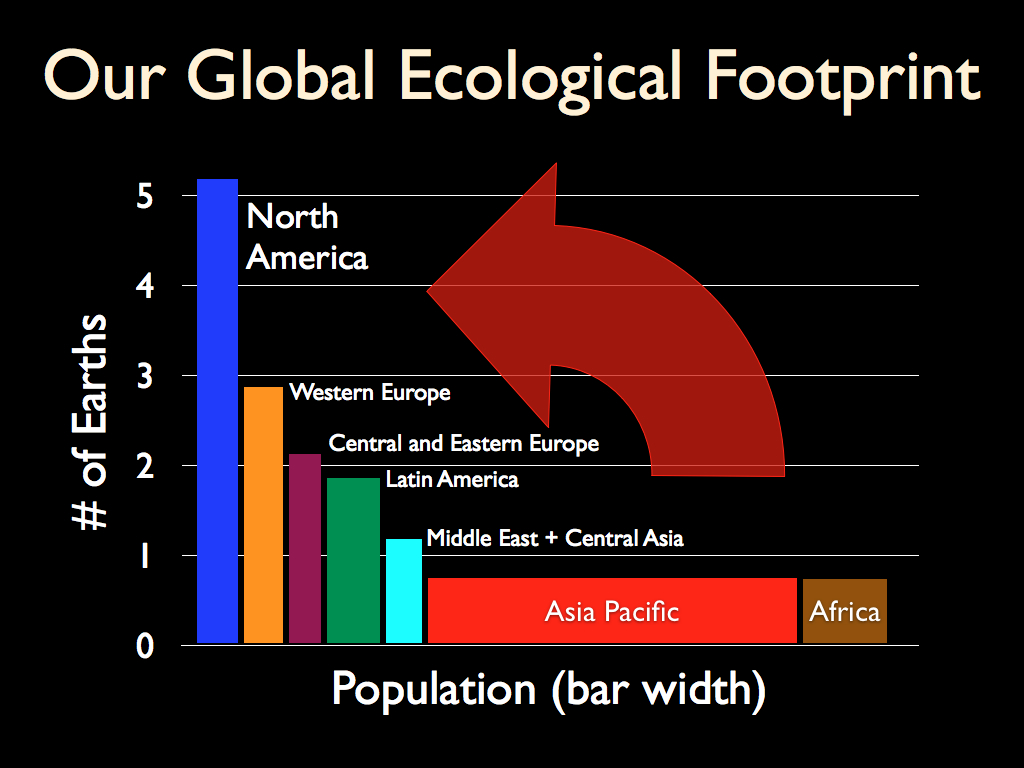
Using ecological footprint data from Global Footprint Network we can see the current state of consumption for North America and the rest of the world. American per capita consumption is legend. China and India are adopting their own versions of American-style consumerism. All nations are bumping up against the limits of the earth to provide what is needed for growth. We are collectively challenged to find new ways to grow, more lightly, in ways that restore rather than deplete.

Global Ecological Footprint

N.B. The width of bar proportional to population in associated region. Ecological Footprint accounts estimate how many Earths were needed to meet the resource requirements of humanity for each year since 1961, when complete UN statistics became available. Resource demand (Ecological Footprint) for the world as a whole is the product of population times per capita consumption, and reflects both the level of consumption and the efficiency with which resources are turned into consumption products. Resource supply (biocapacity) varies each year with ecosystem management, agricultural practices (such as fertilizer use and irrigation), ecosystem degradation, and weather.
 
This global assessment shows how the size of the human enterprise compared to the biosphere, and to what extent humanity is in ecological overshoot. Overshoot is possible in the short-term because humanity can liquidate its ecological capital rather than living off annual yields.

Highlights from Robert Reich’s Why Growth is Good

Economic growth is slowing in the United States. It’s also slowing in Japan, France, Britain, Italy, Spain, and Canada. It’s even slowing in China. And it’s likely to be slowing soon in Germany.

If governments keep hacking away at their budgets while consumers almost everywhere are becoming more cautious about spending, global demand will shrink to the point where a worldwide dip is inevitable.

You might ask yourself: So what? Why do we need more economic growth anyway? Aren’t we ruining the planet with all this growth — destroying forests, polluting oceans and rivers, and spewing carbon into the atmosphere at a rate that’s already causing climate chaos? Let’s just stop filling our homes with so much stuff.

The answer is economic growth isn’t just about more stuff. Growth is different from consumerism. Growth is really about the capacity of a nation to produce everything that’s wanted and needed by its inhabitants. That includes better stewardship of the environment as well as improved public health and better schools. (The Gross Domestic Product is a crude way of gauging this but it’s a guide. Nations with high and growing GDPs have more overall capacity; those with low or slowing GDPs have less.)

Poorer countries tend to be more polluted than richer ones because they don’t have the capacity both to keep their people fed and clothed and also to keep their land, air and water clean. Infant mortality is higher and life spans shorter because they don’t have enough to immunize against diseases, prevent them from spreading, and cure the sick.

In their quest for resources rich nations (and corporations) have too often devastated poor ones – destroying their forests, eroding their land, and fouling their water. This is intolerable, but it isn’t an indictment of growth itself. Growth doesn’t depend on plunder. Rich nations have the capacity to extract resources responsibly. That they don’t is a measure of their irresponsibility and the weakness of international law.

How a nation chooses to use its productive capacity – how it defines its needs and wants — is a different matter. As China becomes a richer nation it can devote more of its capacity to its environment and to its own consumers, for example.

The United States has the largest capacity in the world. But relative to other rich nations it chooses to devote a larger proportion of that capacity to consumer goods, health care, and the military. And it uses comparatively less to support people who are unemployed or destitute, pay for non-carbon fuels, keep people healthy, and provide aid to the rest of the world. Slower growth will mean even more competition among these goals.

Faster growth greases the way toward more equal opportunity and a wider distribution of gains. The wealthy more easily accept a smaller share of the gains because they can still come out ahead of where they were before. Simultaneously, the middle class more willingly pays taxes to support public improvements like a cleaner environment and stronger safety nets. It’s a virtuous cycle. We had one during the Great Prosperity the lasted from 1947 to the early 1970s.

Slower growth has the reverse effect. Because economic gains are small, the wealthy fight harder to maintain their share. The middle class, already burdened by high unemployment and flat or dropping wages, fights ever more furiously against any additional burdens, including tax increases to support public improvements. The poor are left worse off than before. It’s a vicious cycle. We’ve been in one most of the last thirty years.

No one should celebrate slow growth. If we’re entering into a period of even slower growth, the consequences could be worse.

For some excellent reading on this subject, check out the Recommended Reading section on Sustainable Business, Government, and Community. I especially found useful Lester Brown’s Plan B 4.0 and Jeffrey Sachs’ Common Wealth.

Consumer Behavior: Deleveraging

Roger Lowenstein, an outside director of the Sequoia Fund, and author of The End of Wall Street has an article in The New York Times called Paralyzed by Debt.

Highlights of the article are below. It is an excellent example of the impact uncertainty and consumer unease can have on consumer behavior. To put the article in context, here are a couple charts I use when talking about consumer behavior and impact on business and government economic models.

Maslow's Hierarchy of Needs

In Maslow’s hierarchy, the higher level needs can only be met when the foundational needs are solid. When something like the current recession, or high oil prices, or job insecurity occur, uncertainty rises and undermines our sense of wellbeing. We shift our focus to the basics – do we have a stable home situation, can we pay the mortgage, do we have a job, can we depend on it, can we afford healthcare, etc.? In short, the consumer mind shifts from Thrive to Survive.

Maslow's Hierarchy of Needs - from thrive to survive

We can see a practical example of this in the Personal Savings Rate.  As the US entered the 2008 recession, the Personal Saving Rate, which has been trending down, did a stunning reversal in a single quarter, pivoting from .8 percent to almost 6 percent.

Personal Saving Rate

Lowenstein details how economic uncertainty impacted refinancing his home.

Highlights from NY Times Article: Paralyzed by Debt

Last month, my wife and I refinanced our mortgage. Though the rate was lower and we could have afforded more debt, we paid down a chunk of the balance. Don’t ask me why — it just felt better to owe less money. Time was, such thrift would have been hailed as patriotic. Now it threatens the economic recovery. Less borrowing means less to spend.
Suppose everybody did this? Well, it turns out, everybody has. Eschewing trips to the mall, Americans are paying off credit-card balances and home-equity lines. Despite low rates, mortgage demand has plummeted.

  • 12.5% of household after-tax income is devoted to repaying debts (source: The Federal Reserve Board, 2010)
  • Half of American workers have suffered a job loss or a cut in hours or wages over the past 30 months.
  • The economy is Deleveraging. Credit in the economy is shrinking, as opposed to the normal state of affairs, in which, each quarter, people borrow more money and banks issue more loans.

Remarkably, this deleveraging has been going on for nearly two years. Ordinary Americans are behaving just as the banks they love to excoriate — having, formerly, assumed too much risk, they are going into hibernation. If credit, in the words of the writer James Grant, is money of the mind, people have become psychologically indisposed to minting it.

  • Total household credit has contracted for seven straight quarters.
  • Mortgage debt is down $462 billion from the peak, which it reached in November 2008.
  • Bank-card borrowings, which peaked two months later, are off $126 billion.
  • Auto loans have fallen $122 billion; home-equity lines, $77 billion.

As Stephanie Pomboy, publisher of the newsletter Macro Mavens, has pointed out, government transfers like stimulus spending and tax credits masked the effects of diminishing credit for a while. That is to say, even if people were unwilling to borrow, they were happy to spend money they got from the government. Now that government supports are being pulled away, the effects of deleveraging are in plain view. Home and car sales are plummeting again. Job growth has shrunk to a sliver. Personal bankruptcies are soaring. Deflation, a dangerous state of economic dead air, when prices fall from lack of demand, is a distinct possibility.

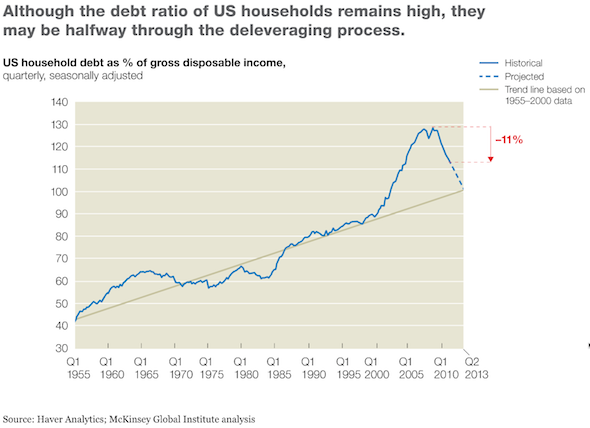
  • In 2001, household debt reached a par with annual after-tax household income. (The average family owed what it earned.) By the peak of the bubble, in 2008, borrowings had surged to 36 percent more than income.

Which raises the issue: how much of that debt will have to be repaid before people return to their customary, and stimulative, profligacy? Thus far, we have undone only a portion of the excess. Household debt now stands at 26 percent more than income — still very high by historical standards. “There is no magical level where it should be,” says David Resler, an economist with Nomura Securities. “There is no clear equilibrium.”

  • To return to the status quo of before the housing boom — say, back to debt to income ratios prevailing in 2000 — it would take five more years of deleveraging at the current rate.

McKinsey recently published an excellent review of the global deleveraging process that began in 2008.  From their report:

Americans steadily increased their debt levels for a good six decades, but it wasn’t until the turn of the millennium that the ratio of household debt to income really soared. Yet by the second quarter of 2011, three years after the start of the global economic crisis, the US ratio had fallen 11 percent from its peak. At the current rate of deleveraging, it would return to trend as of mid-2013—a conclusion buttressed by a comparison between US households today and those of Sweden and Finland during the 1990s, when the two Scandinavian countries endured similar banking crises, recessions, and deleveraging episodes. In both, the ratio of household debt to income fell by roughly 30 percent from its peak. As the exhibit below shows, the United States has been closely tracking the Swedish experience, while households in Spain and the United Kingdom have only just begun to deleverage. To learn more, read “Working out of debt” (January 2012).

US deleveraging - US household debt as percent of gross disposable income

global deleveraging - US, UK, Spain, Sweden