This American Life on Climate Change

this american life, ira glassYesterday, on our way to a party, my wife Sue and I tuned in to NPR’s This American Life.  Radio host IRA Glass introduced three increasingly compelling segments on the topic of climate change – Hot In My Backyard. When we got to our destination, we didn’t want to get out of the car.  We didn’t want to miss a word.

First up was Colorado’s State Climatologist, Nolan Doesken. As reporter Julia Kumari Drapkin explained, Doesken has long believed the humans are driving climate change, but never connected it to his own life. Even after several years of some of the most devastating weather his state has ever seen, Nolan considered climate change a worry for the future. Then, last year, he watched as his state experienced some of the most extreme weather it has ever seen. For the first time, Nolan felt like he was looking at what the future would be like where he lives. He felt scared. Julia tells the story of how this has all changed Nolan, and changed what he’s saying to the people of his home state.

Next up was Producer Ben Calhoun telling the story of a former Congressional Representative from South Carolina, Bob Inglis. Inglis is a conservative Republican who once doubted climate science. After he looked at the research, he changed his mind, and decided to speak out. In 2010, he was mocked by people in his own party and trounced by a Tea Party-backed candidate. Since then, Bob has dedicated himself to the issue even more — and he’s now trying to create a conservative coalition for climate change action.  For more on Inglis, see an article I wrote on him back in 2010: GOP Rep. Bob Inglis On Climate Change

The third and final segment has host Ira Glass telling the story of writer turned activist Bill McKibben. Glass tells us McKibben is trying to reinvent progressive politics when it come to climate change. He’s attempting to create a divestment campaign modeled after the successful campaign against apartheid in South Africa. The campaign is designed to recast the discussion of climate change, with fossil fuel companies as the villains.

Shortly after the segment ended, I turned the car off, and Sue and I walked up through friends Robin and Lyn’s rolling land, past a very active hand hewn bee hive, through abundant gardens of spring vegetables, herbs, and fruit trees, ultimately arriving at a pickleball court, where friends gamed on, in the warmth of the afternoon sun.

I knew Robin and Lyn’s daughter Annie would be there, back from Washington, DC, and I was looking forward to seeing her.  Annie is walking the talk.  If you listen to the Bill McKibben segment above, you will hear a lot about how divestment is increasingly being used as an effective tool against corporate bad business.  Annie is in the thick of it.  She works for The Conflict Risk Network — encompassing about 80 members including pension funds, some of the world’s largest asset management firms, government entities, university endowments, foundations, financial service providers and socially responsible investment firms. They harnesses the collective weight of more than $6 trillion in investment assets.  And they use that weight to challenge corporate actions and misconduct that hurt our society.

Listening to This American Life was the perfect warm-up to conversation with Annie. I love how serendipity shows up when you least expect it.  And I especially love how young people like Annie are forging a path of active informed engagement on the burning issues of the day.
 

Dan Kammen: On Climate Change and Renewable Energy

At a recent Crossroads Lecture, energy policy expert Daniel Kammen spoke about Energizing the Low-Carbon Future. His presentation is timely – climate change has been on the public mind as hurricane superstorm Sandy devastated New York, New Jersey, and beyond. Though we would all agree that energy is an essential part of our daily life, Americans spend more money on potato chips than on energy research and development. Dan has a deep nuanced understanding of where we are at, and where we need to go, to build a clean, sustainable energy future.

In the presentation below, Dr. Kammen explores innovations in, and barriers to, building renewable energy systems worldwide – from villages to large regional economies.  He discusses tools already available, and others needed, to speed the transition to a sustainable planet. Daniel Kammen is Professor in the Energy and Resources Group (ERG), Professor of Public Policy in the Goldman School of Public Policy at the University of California, Berkeley. He is also the founding Director of the Renewable and Appropriate Energy Laboratory (RAEL). Kammen advises the World Bank, and the Presidents Committee on Science and Technology (PCAST), and is a member of the Intergovernmental Panel on Climate Change (Working Group III and the Special Report on Technology Transfer).

Dan spoke for about an hour, followed by a 35 minute question and answer session. The Q&A session has some great questions and discussion.

Dan talked about cleantech jobs, the economic benefits of transitioning to renewable energy, climate change, coal, natural gas, arctic sea ice loss, peak oil, the real cost of coal and other high-carbon sources of energy, solar energy, and energy storage.  One of my favorite quotes:

When you are spending your funds buying fuels as a fraction of the cost of the technology, it’s a very different equation than when you are investing in people, training, new companies, and intellectual capital. [And so, for example] if you buy a gas turbine, 70 percent of the money that will go in to that, over its lifetime, is not going to be for human resources and hardware, it’s to buy fuel. If you buy renewable energy and energy efficiency, while we have a problem of needing to find ways to amortize up-front costs, you are investing in people, companies, and innovation.

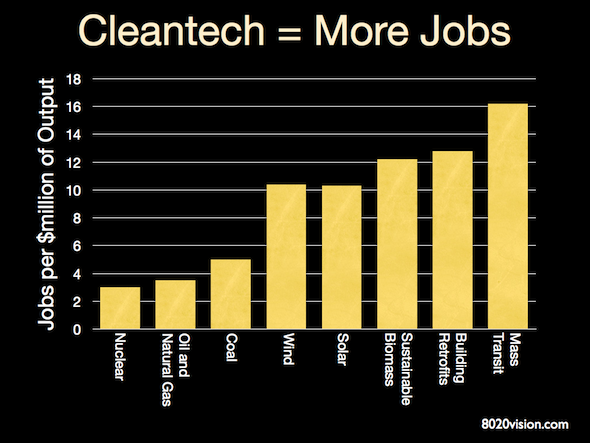
Jobs created, per dollar invested, are consistently higher for cleantech jobs versus old fossil fuel based energy sources. Economist Robert Solow, in his Nobel prize winning work on the drivers of economic growth, demonstrated that about 75 to 80 percent of the growth in US output per worker was attributable to technical progress and innovation.  Transitioning to renewable forms of energy will provide strong stimulus to our economy, while reducing public health and environmental costs associated with dirty coal and oil pollution.

cleantech renewable energy conservation jobs chart
(source: Political Economy Research Institute, University of Massachusetts Amherst)

After Dan Kammen finished overviewing climate change and energy issues, he highlighted several case studies that featured renewable energy and low-carbon energy production implementations for small (personal), medium (community) and large (national) installations.  Watch the video above for more.

Recommended Reading

Climate Change

Energy


Income Inequality: A Congressional Report Card

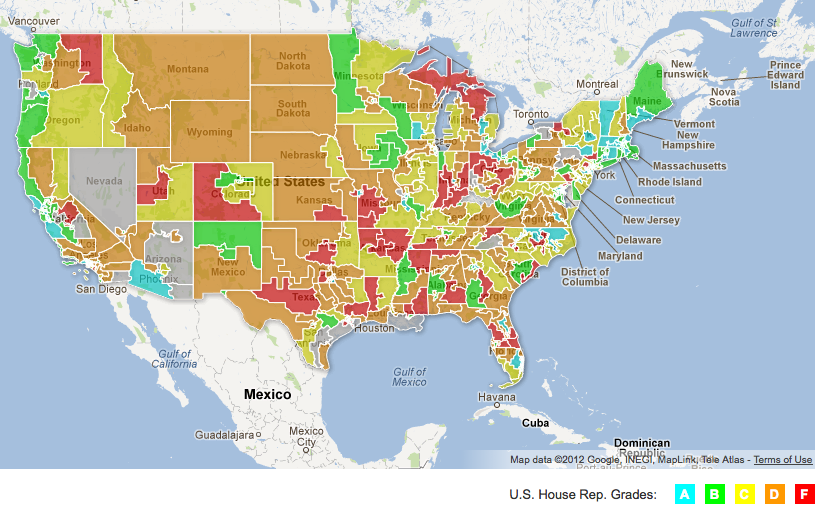
The Institute for Policy Studies (IPS) just released their first Inequality Report Card. It evaluates each congressional representative’s voting record on 40 bills aimed at reducing income inequality. Legislation ranges from the ” Buffet Rule” that would establish a minimum tax rate for upper-income Americans to increasing the minimum wage and indexing it to inflation.

The report includes an overall “honor roll” — to highlight those representatives and senators who have done the most to narrow America’s economic divide — as well as a “dishonor roll” of lawmakers who have repeatedly tilted the “1%” way. The report card also details the “most 1% friendly” and “most 99% friendly” by party affiliation.

IPS gave each congressperson a grade, A through F.

See how your representatives did on the Inequality Report Card. Click on the map below and find your representative based on where you live. The colors represent the different grades each house member received. If your not happy with what they are doing, the map includes a quick simple button to contact your member of congress.

Income Inequality report card map
(click for larger image)

Income inequality in the US is at an all time high. As measured by the Gini Index, the US ranks with Rwanda and Uganda in income inequality.

Recommended Reading

Who Stole the American Dream? by Hedrick Smith

When Does the Wealth of a Nation Hurt its Wellbeing? by Jay Kimball

Hedrick Smith: Who Stole the American Dream? by Jay Kimball (includes video talk by Hedrick Smith)


Hedrick Smith: Who Stole the American Dream?

Veteran investigative reporter and Pulitzer Prize winner Hedrick Smith’s new work, Who Stole the American Dream?, steps back from the partisan fever of the 2012 campaign to explain how we got to where we are today — how America moved from an era of middle class prosperity and power, effective bipartisanship, and grass roots activism, to today’s polarized gridlock, unequal democracy and unequal economy that has unraveled the American Dream for millions of middle class families.

On 22 September 2012, Hedrick Smith spoke at the Parish Hall on Orcas Island, WA, as part of the Crossroads Lecture Series. He spoke for about an hour, followed by a 20 minute question and answer session. His book is available on Orcas Island at Darvill’s Bookstore (a signed copy), or at Amazon.

Smith’s book is brimming with fascinating insider stories that detail the shift from  a strong middle class of the 50s and 60s, to the current weakened middle class, with an income inequality that is at an all time high, ranking with that of Rwanda and Uganda.

This didn’t happen by accident. Smith details how, beginning in the 1970s, corporate attorney Lewis Powell sparked a political rebellion with his call to arms for Corporate America. Like a gripping detective story, Smith follows the trail through to present day.  Chronicling a stunning shift in power, away from a healthy growing middle-class, toward a superPACed, lobbyist fueled, special interest driven, well oiled, corporate powered, political machine.

Over the past decade, at the center of the machine, stands the “Gang of Six” and Washington insider Dirk Van Dongen, the man behind the curtain, who coordinates very effective lobbying of our elected officials.  The Gang of Six include the U.S. Chamber of Commerce, the Business Roundtable, the National Association of Manufacturers, the National Federation of Independent Business, the National Restaurant Association, and Van Dongen’s own National Association of Wholesaler-Distributors.

Who Stole the American Dream? makes for compelling reading, and at the end, Smith offers up a grassroots-centered strategy for reclaiming the dream – restoring balance to our economy and re-building a healthy middle-class.  The video above will give you a summary understanding of what is well detailed in his book.

Corporate lobbyists funnel billions of dollars to our elected officials each year. Recent studies show that for every dollar spent lobbying, business receives over $220 back in legislation that favors the business.

On climate change alone, 770 companies hired 2,340 lobbyists, up 300% in past 5 years. Most of those companies have vested interests in fossil fuels and benefit from delay of legislation that would speed the transition to clean energy.

In 2011 private companies and special interest groups spent $3.32 billion lobbying their agendas. In 2010, they spent even more at $3.54 billion. From 2008 to 2010, 30 Fortune 500 companies spent more money on lobbying than they did on taxes.

In an unusual moment of candor, here’s what Senator Dick Durbin had to say about corporate money and politicians:

I think most Americans would be shocked, not surprised, but shocked if they knew how much time a United States Senator spends raising money.
And how much time we spend talking about raising money, and thinking about raising money, and planning to raise money.” Dick Durbin, 30 March 2012

Depending on status and influence, our elected officials in Congress typically raise about $5,000 to $30,000 per day. They spend a good part of each day dialing for dollars, asking businesses to send them money.  It is against the law (the Hatch Act) to make those calls from government property, so they walk to call centers located conveniently just a few minutes from Capitol Hill.

Money in Politics

For more on how corporations and our elected officials are joined at the hip, see the excellent series on Money in Politics.  Here’s an excerpt from that series:

So senators and congressmen go across the street to private rooms in nongovernmental buildings, where they make call after call, asking people for money.
In other words, most of our lawmakers are moonlighting as telemarketers.

“If you walked in there, you would say, ‘Boy, this is the about the worst looking, most abusive looking call center situation I’ve seen in my life,'” says Rep. Peter Defazio, a Democrat from Oregon. “These people don’t have any workspace, the other person is virtually touching them.”

There are stacks of names in front of each lawmaker. They go through the list, making calls and asking people for money.

The fundraising never stops, because everyone needs money to run for re-election. In the House, the candidate with more money wins in 9 out of 10 races, according to the Center for Responsive Politics, a nonpartisan group that tracks money in politics. In the Senate, it’s 8 out of 10.

It’s not uncommon for congressmen to average three or four hours moonlighting as telemarketers. One lawmaker told me if it was the end of the quarter and he really needed to make his numbers, he’d be there all day long.

The fox is in the hen house.  Time to get the big money out of politics. Surely our elected representatives don’t want to do this demeaning begging for money. Surely they would like to start making laws and setting public policy based on the merits of an issue. Right?

Recommended Reading

Who Stole the American Dream? by Hedrick Smith

When Does the Wealth of a Nation Hurt its Wellbeing? by Jay Kimball

Income Inequality: A Congressional Report Card by Jay Kimball

Money in Politics part of the NPR Planet Money series

Fair Elections Now Act is legislation to get big money out of Federal elections and replace it with grassroots public funding.  More details here and here.


How Much Water is on Earth?

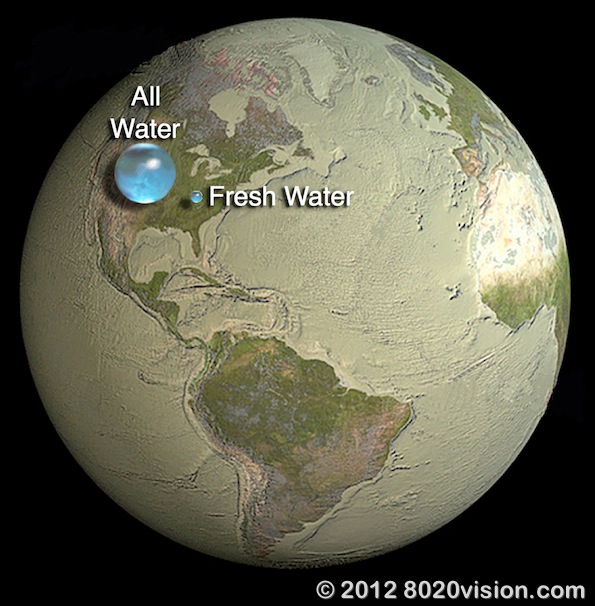
The US Geological Survey (USGS) recently published a remarkable image helping us appreciate the preciousness of water. We have all probably heard the oft-quoted statistic that about how 70 percent of the Earth’s surface is water-covered – most of it in the form of oceans. Though it sounds like a lot, if we gathered all that water up, how much space would it take up?  The USGS, in the image below, shows us that the answer is… not much.

global water volume, USGS, earth water
click for larger image (Illustration by Jack Cook, Woods Hole Oceanographic Institution (©) Howard Perlman, USGS)

Though about 97% of Earth’s water is in the form of oceans, these oceans are shallow compared to the Earth’s radius – just a couple miles deep.  The image above shows us just how shallow the oceans are, using radar image data, mapping the bottom of the ocean. The blue sphere shows what would be required to contain all Earth’s water – from oceans, lakes, rivers, glaciers, snowpack, etc. The sphere has a radius of just 700 kilometers.

When this picture appeared in the news, I found myself wondering what portion of that sphere was fresh water. I noted a number of reader comments asking the same thing. It’s an important question. The Food and Agriculture Organization of the United Nations (FAO) projects that two-thirds of the planet will be water stressed by 2025.  Safe drinking water and abundant water for irrigation will become increasingly scarce.

So what size sphere would be required to hold all the accesible fresh water in the world? The picture below shows the answer.  But first, using USGS water data, let’s look at how the size of that fresh water sphere was calculated:

The Math:

  • As the USGS demonstrated, all Earth’s water (1,386,000,000 cubic kilometers) can be contained in a sphere with radius of about 693 kilometers.
  • Of that water, only about .77% is fresh water, usable by humans (ground water, lakes, rivers, etc.)  N.B.: An additional 1.74% of global water is stored as glaciers, ice caps and permanent snow, but is not accessible and usable.
  • .77% x 1,386,000,000 cubic kilometers = 10.7 million cubic kilometers of fresh water
  • 10.7 million cubic kilometers of fresh water = a sphere with radius of 137 kilometers

Here’s the updated image, with spheres representing “All Water” and “Fresh Water” – side by side.

total water and total freshwater on earth
(source: USGS data, 8020 Vision calculations)

Related Articles


Last Call at the Oasis

Last Call at the Oasis just opened in movie theaters this past Friday. Film critic Christopher Campbell said it best: Last Call at the Oasis is “necessary viewing for anyone on the planet who drinks water.

It helps us understand how water is central to every part of our lives, shows how it is becoming more scarce and in some cases toxic, and offers examples of ways to conserve water more effectively, reduce pollution, and manage our precious water resources better.

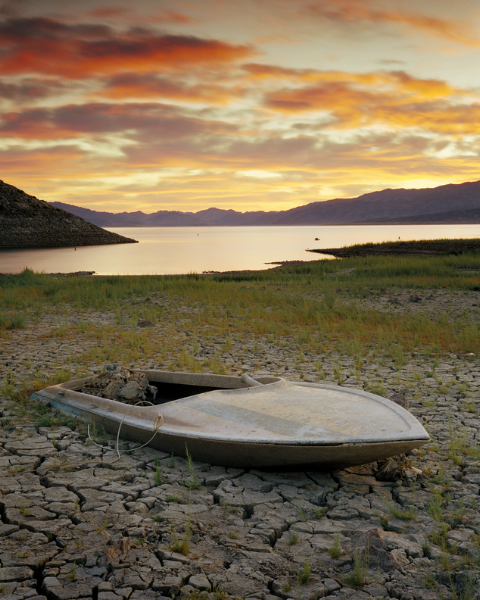
The movie trailer is below.  As you watch it, note the lake that appears at 45 seconds in to the trailer.  That is Lake Mead.  It is the main source for water to Las Vegas, and feeds the Hoover Dam, which generates electricity for Las Vegas and beyond. The lake has been around for a very very long time, and, according to Scripps Institution of Oceanography, will likely be dry in the next 10 years.  Increased consumption and changing climate have caused the lake to drop an average of 10 feet per year. In 4 years, the water level will likely drop so low that Hoover Dam will be unable to operate.

Here’s a picture of Lake Mead taken in 2007.  It was bad then and it’s worse now.

Lake Meade water scarcity
A picture of Lake Meade taken in 2007

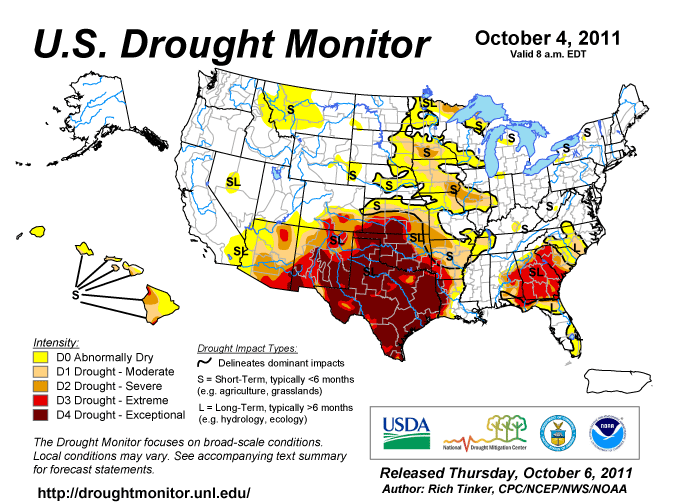
I was driving through Texas last summer, and all the radio stations could talk about was how hot and dry it was.  At that time, Austin had over 70 days straight of temperatures above 100 degrees F.  Wildfires raged as the drought-parched land baked to a crisp. Here’s a drought map that shows just how extensive the drought was.  Note that the brownish-red areas are ranked as “Exceptional” – beyond even extreme drought.

Water - US Drought Map, Texas drought
Record Texas drought in 2011

As climate change continues its slow inexorable advance, we should expect to see the southern US trend much drier and hotter.  Agriculture and ranching will become unsustainable.  Humans will need to be very good at conserving and getting by with much less water. Last Call at the Oasis is a wakeup call.

Here’s the movie trailer for Last Call at the Oasis

Consider seeing the movie. It helps us understand how we can preserve our precious water resources. It is so much more satisfying being part of the solution, than being part of the problem.

Recommended Reading

Water Scarcity in the US

The Real Population Problem

Congress Releases Report on Toxic Chemicals Used In Fracking