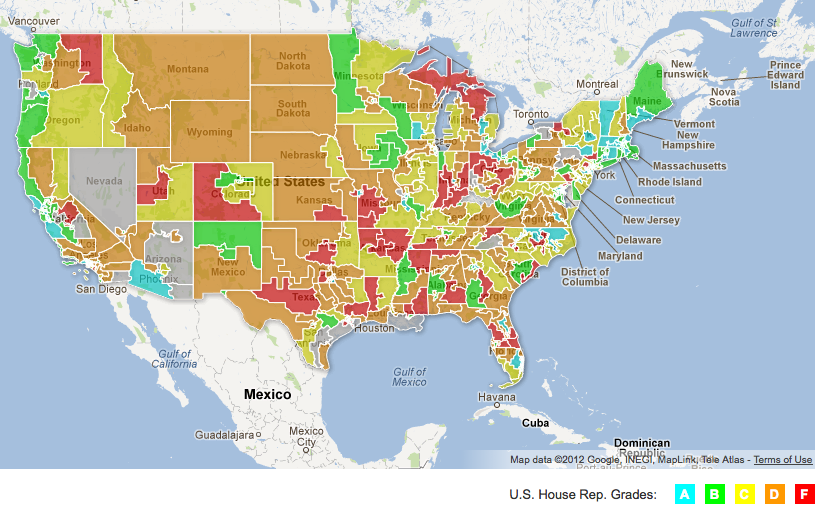
The Institute for Policy Studies (IPS) just released their first Inequality Report Card. It evaluates each congressional representative’s voting record on 40 bills aimed at reducing income inequality. Legislation ranges from the ” Buffet Rule” that would establish a minimum tax rate for upper-income Americans to increasing the minimum wage and indexing it to inflation.
The report includes an overall “honor roll” — to highlight those representatives and senators who have done the most to narrow America’s economic divide — as well as a “dishonor roll” of lawmakers who have repeatedly tilted the “1%” way. The report card also details the “most 1% friendly” and “most 99% friendly” by party affiliation.
IPS gave each congressperson a grade, A through F.
See how your representatives did on the Inequality Report Card. Click on the map below and find your representative based on where you live. The colors represent the different grades each house member received. If your not happy with what they are doing, the map includes a quick simple button to contact your member of congress.

Income inequality in the US is at an all time high. As measured by the Gini Index, the US ranks with Rwanda and Uganda in income inequality.
Recommended Reading
Who Stole the American Dream? by Hedrick Smith
When Does the Wealth of a Nation Hurt its Wellbeing? by Jay Kimball
Hedrick Smith: Who Stole the American Dream? by Jay Kimball (includes video talk by Hedrick Smith)
One thought on “Income Inequality: A Congressional Report Card”
Comments are closed.