Water Scarcity in the US

When I talk with groups about water, here are some factoids that usually surprise:

  • By 2020, California will face a shortfall of fresh water as great as the amount that all of its cities and towns together are consuming today.
  • By 2025, 1.8 billion
 people will live in conditions of absolute 
water scarcity, and 65 percent of the worlds population will be water stressed.
  • To grow a ton of wheat uses 1,000 tons of water. The US is the largest exporter of wheat to the world. When we export a ton of our wheat, we are effectively including 1,000 tons of water in the bargain.
  • In the US, 21 percent of irrigation is achieved by pumping groundwater at rates that exceed the water supplies ability to recharge.
  • There are 66 golf courses in Palm Springs.  On average, they each consume over a million gallons of water per day.
  • Lake Meade (the source of 95% of water for Las Vegas) will be dry in the next 4 to 10 years (see picture below).

Water scarcity is a global problem and is not confined to “poor” nations.
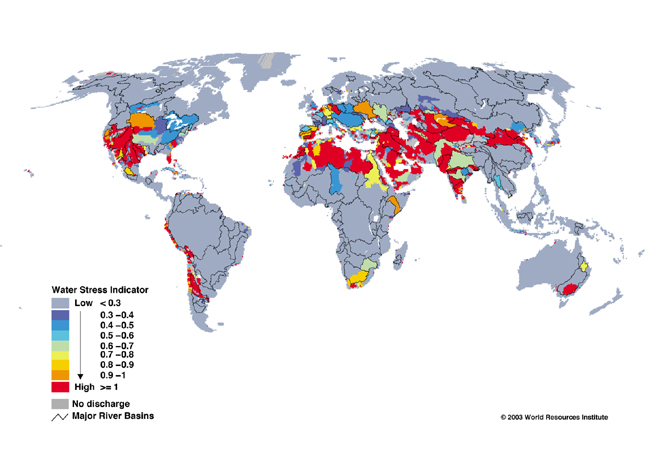
Global Water Stress
Global Water Stress (scource: World Resources Institute)

In the US, we are now seeing headlines about droughts in places like Florida, Georgia, etc. – not your traditional areas of drought. A powerful way to understand the pervasiveness of America’s water scarcity problem is through the following pictures.

This first picture shows areas of the US that are experiencing moderate (yellow), severe (red), and extreme (purple) drought.

US Drought Map (source: NOAA)

The picture above is constantly updated, and now, in fall 2011, Texas is experience unprecedented drought. I was driving through Texas a few weeks ago, and at that time, local radio stations talked about how Austin, as just one example, had experienced 72 days in a row of 100 plus temperatures. Here’s a picture of the current (September 27, 2011) drought situation throughout the US. Note that drought levels in most of Texas are at level D4 – “Exceptional.”
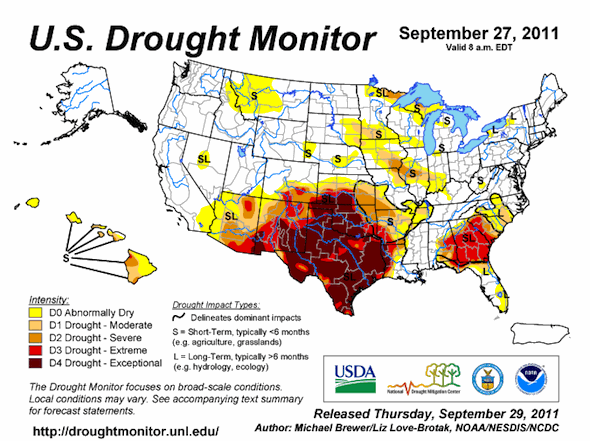
US drought map
US drought map - September 29, 2011 (source: NOA, NESDIS, NCDC)

These dry conditions have fostered endless fires that are sweeping across Texas and throughout the Southwest. Predictions are that the drought will likely last for years. Planners will need to make sure public policy on water conservation are in line with emerging water scarcity conditions. When does a drought become a desert?

Shifting the lens toward the Southwest, here’s a picture of Lake Meade, boating haven and water source for Las Vegas. Current estimates predict it will be dry in the next 4 to 10 years.
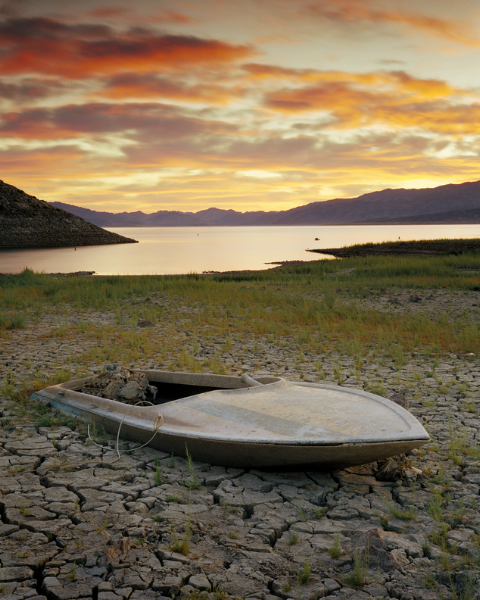
Lake Meade water scarcity
A picture of the fast disappearing Lake Meade taken in 2007

Food production in the “breadbasket” of the US depends on water from the Ogallala Aquifer.  The picture below shows where the sharpest declines in water level are occurring.
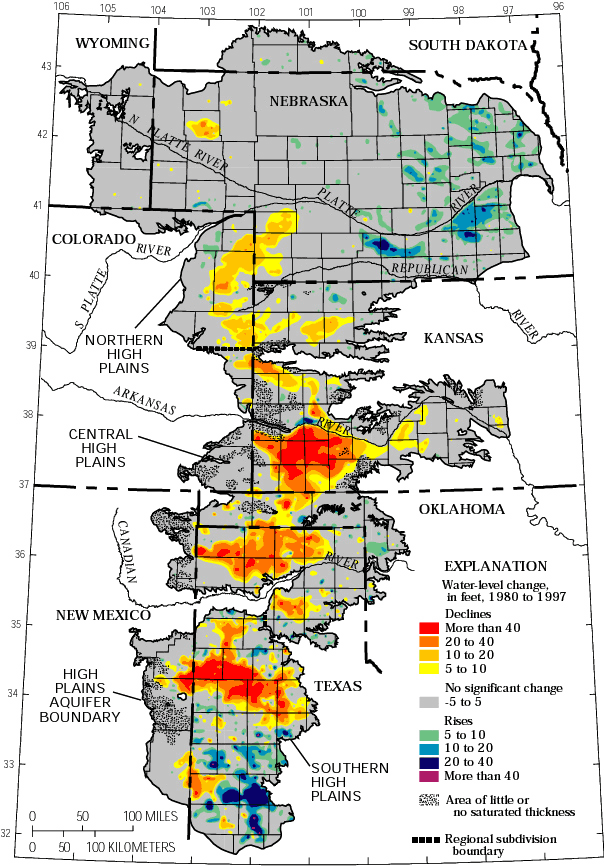
Ogallala Aquifer water shortage
Ogallala Aquifer (source: USGS)
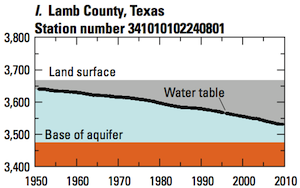
well-level changes in aquifer - Lamb County, Texas
(source: USGS)

The USGS monitors over 9,000 wells throughout the aquifer. Zeroing in on Texas again, here’s a picture of a typical well in Lamb County, Texas. Monitoring of this well started in about 1950, when irrigation began. This well shows a water table that has fallen steadily, and at current draw rates, this well will be dry in the next decade or so. How will farmers, who depend on a reliable source of water to grow crops and ride through accelerating drought, stay in business? How will the drying of the Ogallala Aquifer effect America’s ability to feed the nation?

A recent article in The Texas Tribune sets out the impact Ogallala water scarcity will have on Texas.  This story is not unique and is being played out throughout the 8 state region covered by the Ogallala.

Highlights of the Tribune article:

  • The Ogalala aquifer stretches across 8 states and accounts for 40 percent of water used in Texas.
  • The Ogallala’s volume will fall a staggering 52 percent between 2010 and 2060.
  • The use of big pivot irrigation — the lifeblood of the Panhandle — could be cut back severely in 10 to 20 years.
  • Texans are probably pumping the Ogallala at about six times the rate of recharge.
  • Water conservation and regulation policy is difficult to implement because Texas views groundwater as essentially a property right.
  • T. Boone Pickens business Mesa Water and other companies are buying up water rights, and looking to market water to cities like Dallas.  This is creating a variety of court challenges in the struggle to define the line between public and private water rights.

For more information on the critical issues around private and public access to water, read the well-researched Blue Gold by Maude Barlow and Tony Clarke.
The Real Population Problem

Google Trends tells me that starting in 2008 the monthly number of news stories on population doubled. Most of the stories like to talk about how global population will expand by 30%, peaking at about 9.1 billion people by around 2050.  Though 2050 is a nice round number, and a convenient mid-century marker, one can be lulled in to feeling like it’s a problem that is 40 years off. Not so. The population problem is here and now. And it’s not just about the number of people on the planet, but how those people consume resources.  Let’s take a look at the pertinent trends.

Energy and Population

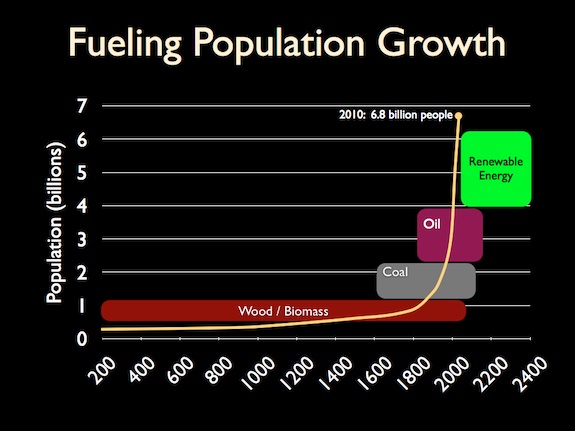
The rate of population growth has a strong correlation with the effectiveness of the dominant fuel source at any given point in history.  As the chart below shows, wood was the dominant fuel until coal came on the scene in the 1600s. The population growth rate increased modestly with the proliferation of coal.  But the real exponential growth began with the discovery and exploitation of crude oil.  Crude oil production is peaking and the world is in the early stages of a transition from fossil fuels to renewable sources of energy.

Fueling Population Growth


China, Brazil and India – Chasing the American Dream

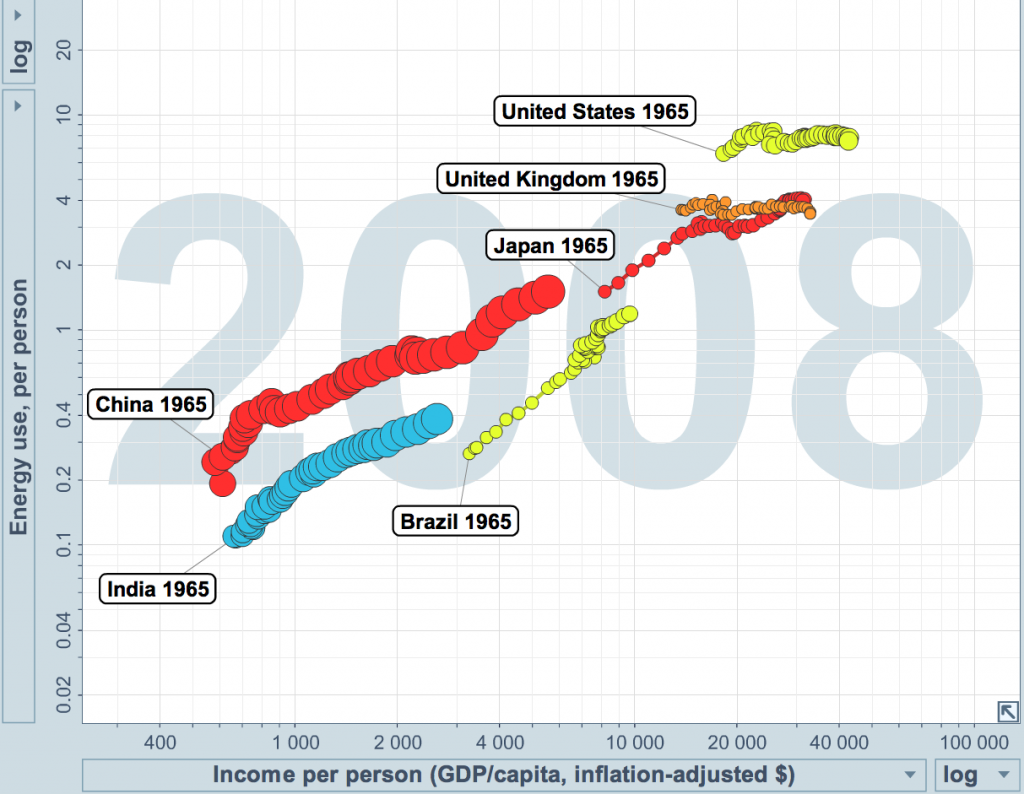
As the population has grown, per capita income and consumption have grown. The most dramatic growth has been in the developing countries of China, Brazil and India. Let’s take a look at the trends in energy use and per capita income relative to some of the leading developed nations. Using GapMinder’s Trendalyzer with energy consumption data from BP’s Statistical Review of World Energy 2010 and income data from the IMF, we can see some powerful trends unfolding (N.B. data presented for 1965 through 2008, 1 year steps, circle area proportional to population size, energy use in tonnes of oil equivalent):

  • China, Brazil, and India all show steadily increasing per capita income, with China having the biggest change – outperforming India and Brazil more than 2 to 1.
  • Though US per capita energy consumption is substantially larger than China, Brazil or India, growth has been flat. This comes from conservation initiatives (efficient lighting, insulation, etc.). We must do better.
  • China, Brazil, and India’s energy consumption is growing quickly as they move toward American patterns of consumption. The trend is strong and steady, with no signs of slowing.
Regional Energy Consumption and Income Trends
(click for larger image)


Less Is The New More

Though Americans represent only 5% of the world’s population, we are consuming about 24% of worlds energy. We are similarly voracious consumers of water, food, land, etc. Citizens in developing nations aspire to live the American lifestyle. Fareed Zakaria refers to this as the “rise of the rest” in his book A Post American World. But the world has only so much to give. Much of what we consume is not renewable. We are bumping up against the limits of earth’s ability to provide for us. As the population expands, for developing nations, their historically meager slice of the pie will expand. For developed nations, their slice of the pie must contract.


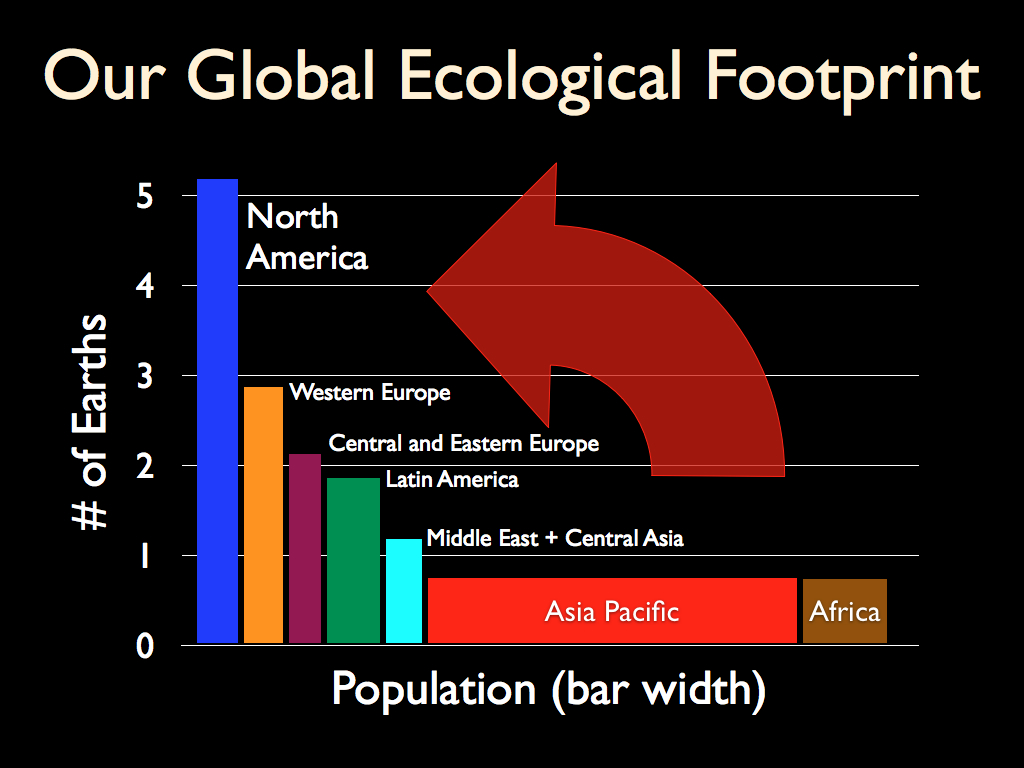
Our Ecological Footprint

Using ecological footprint data from Global Footprint Network we can see the current state of consumption for North America and the rest of the world (N.B. width of bar proportional to population in associated region).

Global Ecological Footprint

N.B. Ecological Footprint accounts estimate how many Earths were needed to meet the resource requirements of humanity for each year since 1961, when complete UN statistics became available. Resource demand (Ecological Footprint) for the world as a whole is the product of population times per capita consumption, and reflects both the level of consumption and the efficiency with which resources are turned into consumption products. Resource supply (biocapacity) varies each year with ecosystem management, agricultural practices (such as fertilizer use and irrigation), ecosystem degradation, and weather.
 
This global assessment shows how the size of the human enterprise compared to the biosphere, and to what extent humanity is in ecological overshoot. Overshoot is possible in the short-term because humanity can liquidate its ecological capital rather than living off annual yields.

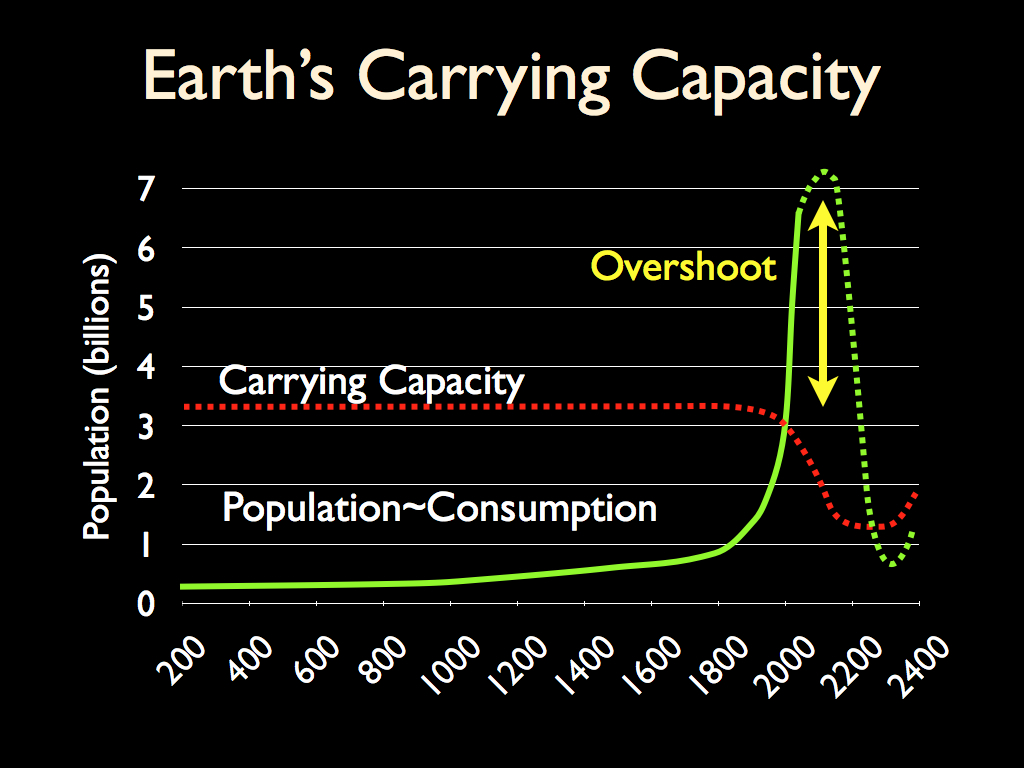
Carrying Capacity

The last sentence of the note above is important. The developed nations are already consuming beyond the earths capacity to provide. Carrying Capacity has been exceeded and as it is exceeded, Carrying Capacity declines. While developed nations are making headway improving conservation, there has been little reduction of consumption – we have simply slowed the rate of per capita consumption. Meanwhile developing nations are moving up the consumption curve, aiming for an American-class lifestyle. Depletion of earth’s precious resources accelerates – oil, potable water, wild fish, species, clean air, etc. are all in decline. Earth’s Carrying Capacity is thought to be somewhere between 1 and 3 billion people. We have been operating the planet well beyond that for almost 50 years now.

Earth's Carrying Capacity

Even if the population stopped growing today, we are consuming beyond the earth’s capacity to provide. With 6.8 billion people already on the planet, the growth of consumption is the population problem, right now.

Zacharia suggests “As each country rises up, they become more self confident and nationalistic, and less inclined to cooperate in global unity toward a common goal of tackling the pressing problems of this century.”

And quoting Hamlet: “There’s the rub.”

  • Population has grown beyond the Carrying Capacity of the earth.
  • Increasing demand for critical resources (energy, water, food, land, …) reduces Carrying Capacity further, and accelerates decline exponentially.
  • Climate is changing, pollution growing, species extinction accelerating.
  • And our ability to work cooperatively to meet these challenges is failing.

This is not sustainable.

How do we break the vicious spiral? How can our global economy – grown soft and pudgy during the 20th century’s age of abundance – adapt and function in the lean and mean dog days of the 21st century?