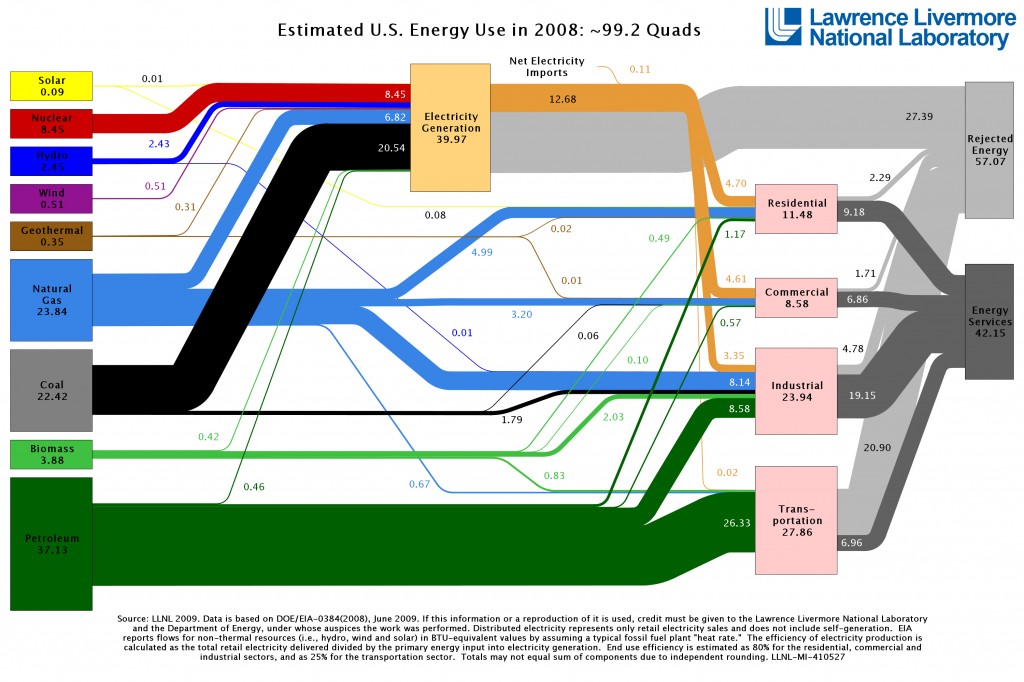
This chart from Lawrence Livermore National Laboratory provides a simple clear way to understand how energy is used in the US.
I use this chart a lot in my presentations. It is a classic example of the adage “A picture is worth a thousand words.” On a single page it shows the sources for the energy we use, where it goes, how much is used and how much is wasted.

Some things to note:
- Energy sources are on the left side – solar, nuclear, hydro, wind, geothermal, natural gas, coal, biomass, petroleum.
- Energy users are broken in to four categories – residential, commercial, industrial, and transportation.
- The gray boxes on the right sum up the energy that was used and the energy that was lost (rejected).
- The width of the lines running from the various energy sources to their destination uses is proportional to the amount of energy used.
Zeroing In On Oil
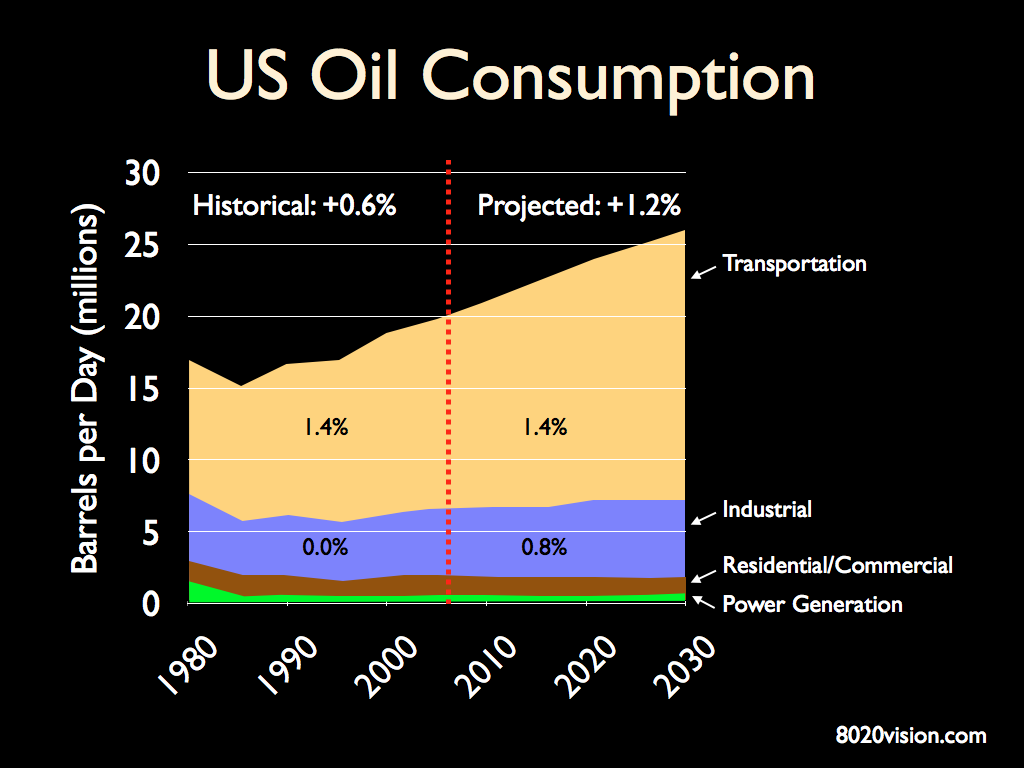
As can be seen, the lion’s share of US energy consumption comes from fossil fuel sources (oil, coal, natural gas). Of the fossil fuels, oil is the source most in demand, the bulk of which is used by the transportation sector. And oil consumption in the transportation sector is growing fast.

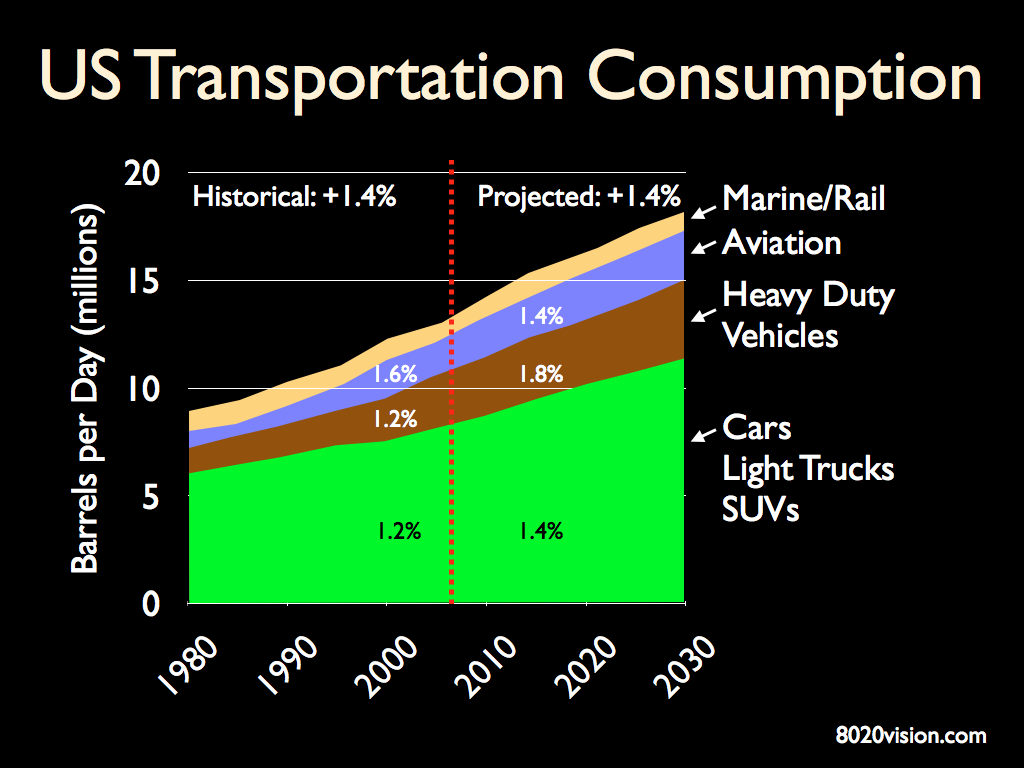
Zooming in to the transportation sector, we can see that most of that oil is used for personal vehicles (cars, light truck and SUVs).

Any attempt to reduce our dependance on oil will require grappling with transportation in general, and personal transportation in particular.
Price of Oil and Consumer Behavior
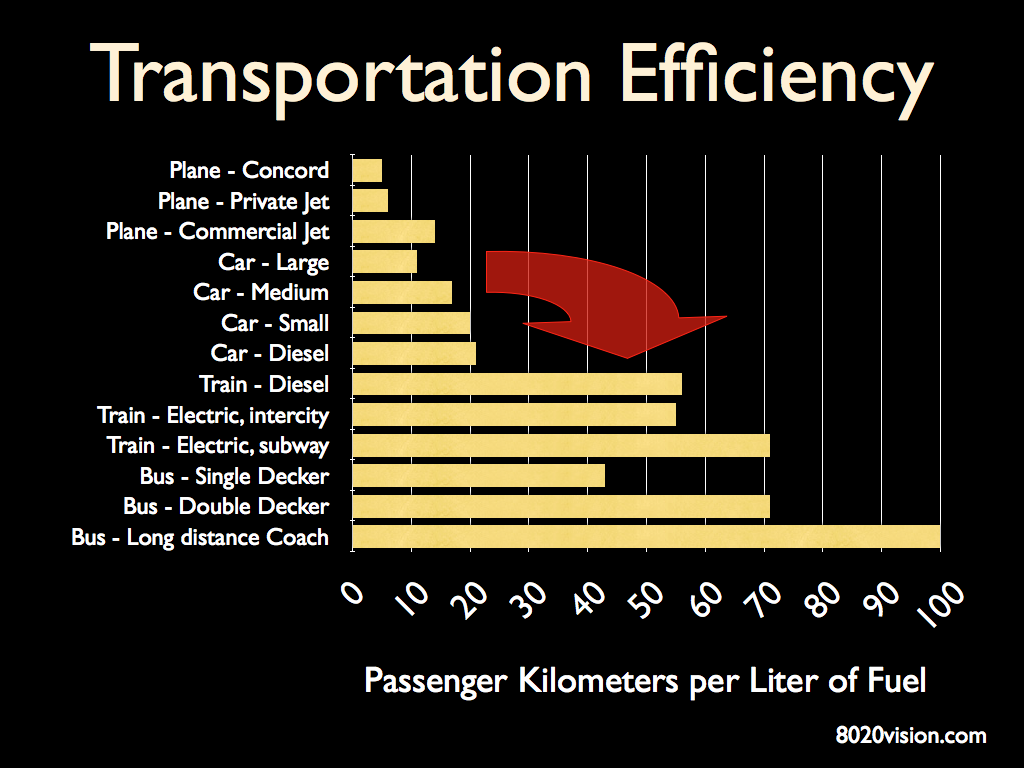
Personal transportation is 4 to 10 times less efficient than public transportation (commuter rail, trains and buses). When oil prices rise quickly, as they did in 2008 (to over $140 per barrel), consumer behavior shifts rapidly. Automobile manufactures saw their large car sales plummet. Airlines saw their fuel costs skyrocket, and bookings plummet. Commuters embraced public transportation, with many metropolitan areas seeing 30 to 45 percent increases in use of public transportation in just one quarter.

That rapid behavior shift represents risk and opportunity for business and government. For more on that, check out two related posts: Sustainable Energy Security: Strategic Risks and Opportunities for Business and Walmart Partnering with Patagonia on Sustainable Business Practices.
The last century was a time of abundance in energy. There is a new economy of scarcity emerging in the 21st century. Understanding the energy trends shaping our world is essential to managing risk and innovating solutions for business, government and community.
Natural energy says:
Nice bog.I like the detailed information on natural energy.
Thanks for sharing this information.I’ll share it with others.
orcasislandtv says:
things sure have changed. Oil consumption for US transportation is off significantly, and the transition to natural gas vehicles is taking place since natural gas supply has taken off. Its my opinion that Peak Oil isn’t the key issue in energy, so much as global warming and other impacts of carbon pollution. http://www.eia.gov/oog/info/twip/twip_gasoline.html
jaykimball says:
Thanks for the comment Alex. Peak oil is related. The easy stuff has been extracted. As we pass through the peak, what remains is increasingly harder to extract (deep water wells, tight oil in shale, etc.) and toxic. That speeds up the spewing of CO2 into the atmosphere and exacerbates global warming. The transition to natural gas takes years and massive outlays for infrastructure, and it still is a serious source of CO2. We want to tax what kills us (tobacco, CO2, etc.) and incentivize what helps us (clean energy, efficiency, etc.).