Climate change news from the National Oceanic and Atmospheric Administration (NOAA):
15 July 2010
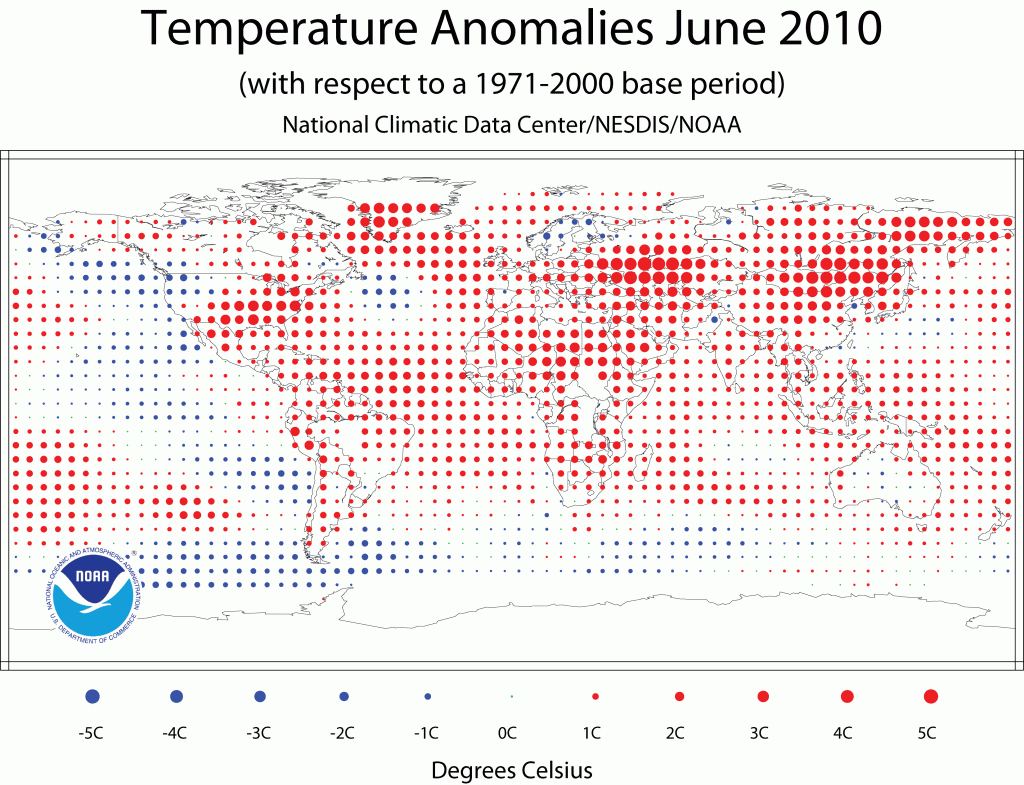
Last month’s combined global land and ocean surface temperature made it the warmest June on record and the warmest on record averaged for any April-June and January-June periods, according to NOAA. Worldwide average land surface temperature was the warmest on record for June and the April-June period, and the second warmest on record for the year-to-date (January-June) period, behind 2007.
The monthly analysis from NOAA’s National Climatic Data Center, which is based on records going back to 1880, is part of the suite of climate services NOAA provides government, business and community leaders so they can make informed decisions.
Scientists, researchers and leaders in government and industry use NOAA’s monthly reports to help track trends and other changes in the world’s climate. This climate service has a wide range of practical uses, from helping farmers know what and when to plant, to guiding resource managers with critical decisions about water, energy and other vital assets.

The Guardian did a nice job of going deeper into the story. Here are highlights from their article:
- The figures released last night by the National Oceanic and Atmospheric Administration (NOAA) suggest that 2010 is now on course to be the warmest year since records began in 1880.
- Scientists expressed surprise that the June land surface temperature exceeded the previous record by 0.11C (0.20F). “This large difference over land contributed strongly to the overall global land and ocean temperature anomaly,” said John Leslie, a spokesman for NOAA.
- Separate satellite data from the US National Snow and Ice Data Centre in Colorado shows that the extent of sea ice in the Arctic was at its lowest for any June since satellite records started in 1979.
- In a further possible sign of a warming world, the Jakobshavn Isbrae glacier, one of the largest in Greenland, lost a 2.7-square mile chunk of ice and retreated one mile between 6-7 July – one of the largest single losses to a glacier ever recorded.
- The glacier, a tongue of the Greenland ice sheet, has retreated six miles since 2000 and more than 27 miles since 1850. It is believed to be the single largest contributor to sea level rise in the northern hemisphere.
- Greenland’s ice sheet, a vast body of ancient ice covering 1.7 million sq km, is melting today more rapidly than only a few decades ago. Since 2000, the ice sheet is calculated to have lost about 1,500 cubic kilometres of water– enough to raise global sea levels by 5mm . If the entire ice sheet melted, the world’s oceans would rise by over 23 feet.
- Glaciologists expressed surprise at the speed of the break-up of the glacier: “This is unusual because it occurs on the heels of a warm winter that saw no sea ice form in the surrounding bay … it lends credence to the theory that warming of the oceans is responsible for the ice loss observed throughout Greenland and Antarctica,” said NASA scientist Thomas Wagner.
Present concentration of carbon dioxide gas in the atmosphere is 31 per cent above pre-industrial levels.
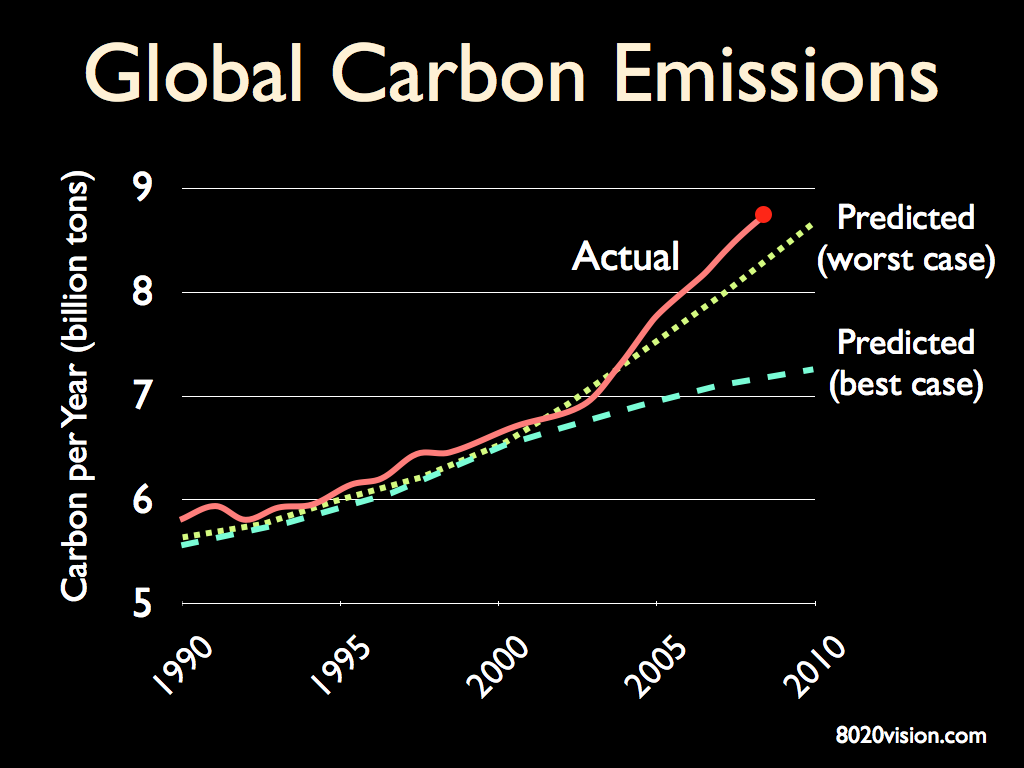
Referring to the chart below, current emissions are tracking above the most intense fossil fuel emission scenario established by the IPCC Special Report on Emissions Scenarios-SRES (2000).

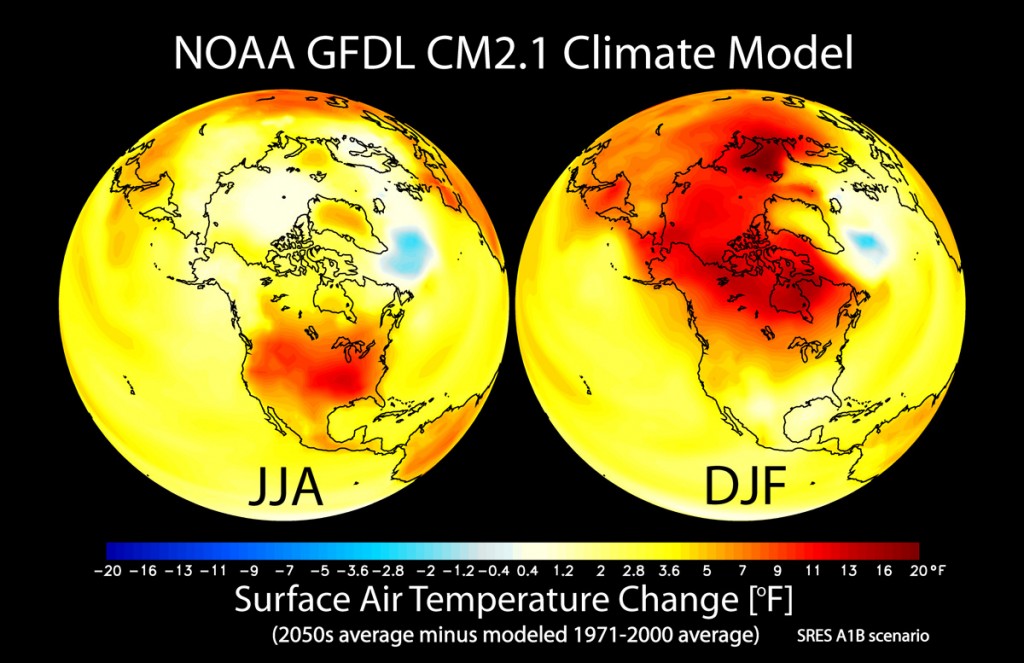
Referring to the chart below, NOAA has modeled change in seasonal mean surface air temperature from the late 20th century (1971-2000 average) to the middle 21st century (2051-2060). The left panel shows changes for June July August (JJA) seasonal averages, and the right panel shows changes for December January February (DJF). The simulated surface air temperature changes are in response to increasing greenhouse gases and aerosols based on a “middle of the road” estimate of future emissions. As we can see from the chart above, we are exceeding “middle of the road” substantially.

Red areas on the map represent a 20 degree increase from averages in the late 20th century. This has major implications for food production, water, and energy, not to mention business as usual.
For a hint of what to expect, look at the infamous 2003 heat wave that struck Europe for just 7 days:
- 30,000 heat-related deaths, 14,802 in Fance alone.
- Extensive forest fires (10% of Portugal forests burned).
- Temperatures ranged from 104 ºF to 118 ºF (40 ºC to 48 ºC).
- Melting glaciers in the Alps caused avalanches and flash floods in Switzerland.
- Extensive crop loss of wheat across Europe (13% to 80%).
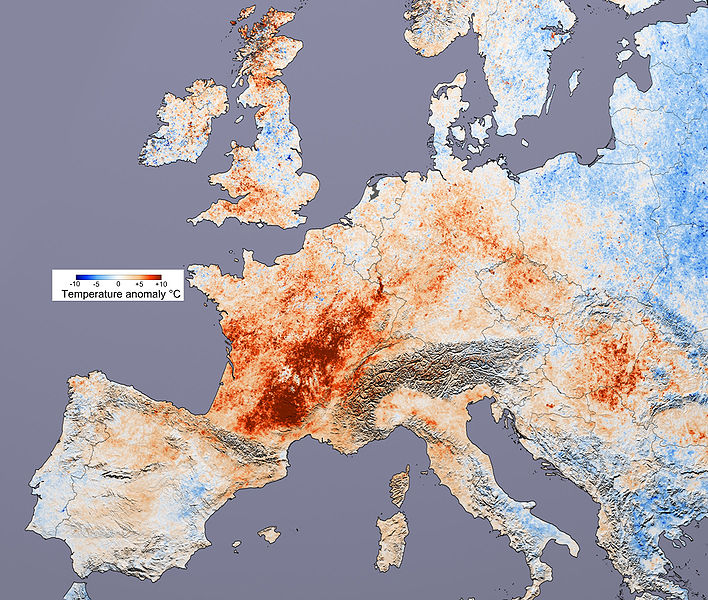
Here’s a picture of the temperature anomaly across Europe during the heat wave. (N.B. Red indicates +10 ºC, +18ºF anomaly)

For related articles and books, see:
Climate Change May Reduce Protein in Crops
0 thoughts on “NOAA: June, April to June, and Year-to-Date Global Temperatures are Warmest on Record”
Comments are closed.