When Does the Wealth of a Nation Hurt its Wellbeing?

With Bush-era tax cuts about to expire, a lot of attention is being focused on extending tax cuts for the rich – suggesting it will help the economy grow. Frank Rich, in his weekly op-ed piece at the New York Times, deconstructs that idea and examines the issue through the lens of income inequality.

The top 1 percent of American earners now have tax rates half what they were in the 1970s. And they took in 23.5 percent of the nation’s pre-tax income in 2007 — up from less than 9 percent in 1976. During the boom years of 2002 to 2007, that top 1 percent’s pre-tax income increased an extraordinary 10 percent every year. In that same period, the average inflation-adjusted hourly wage went down more than 7 percent and the poverty rate rose.
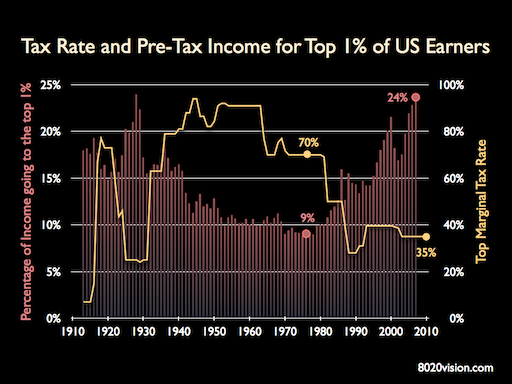
Top 1% Tax Rate and pre-tax Income Trends
(source: IRS micro data, Piketty and Saez)

The rich have been getting richer as their tax rate has steadily eased. And they are taking the added wealth and using it to influence public policy, to the detriment of the middle class.

“How can hedge-fund managers who are pulling down billions sometimes pay a lower tax rate than do their secretaries?” ask the political scientists Jacob S. Hacker (of Yale) and Paul Pierson (University of California, Berkeley) in their deservedly lauded new book, Winner-Take-All Politics

…Inequality is instead the result of specific policies, including tax policies, championed by Washington Democrats and Republicans alike as they conducted a bidding war for high-rolling donors in election after election.

And as Frank Rich points out, the American Dream is not well. Rather than middle class wage earners moving up the ladder, there are less and less people becoming wealthy, and more and more of the wealthy simply becoming wealthier.

Nor are the superrich helping to further the traditional American business culture that inspires and encourages those with big ideas and drive to believe they can climb to the top. Robert Frank, the writer who chronicled the superrich in the book Richistan, recently analyzed the new Forbes list of the 400 richest Americans for The Wall Street Journal and found a “hardening of the plutocracy” and scant mobility. Only 16 of the 400 were newcomers — as opposed to an average of 40 to 50 in recent years — and they tended to be in industries like coal, natural gas, chemicals and casinos rather than forward-looking businesses involving the Green Economy, tech or biotechnology. This is “not exactly the formula for America’s vaunted entrepreneurial wealth machine,” Frank wrote.

Those in the higher reaches aren’t investing in creating new jobs even now, when the full Bush tax cuts remain in effect, so why would extending them change that equation? American companies seem intent on sitting on trillions in cash until the economy reboots. Meanwhile, the nonpartisan Congressional Budget Office ranks the extension of any Bush tax cuts, let alone those to the wealthiest Americans, as the least effective of 11 possible policy options for increasing employment.

The middle class is experiencing the twin stress of falling income and increasing expenses. The most significant household expense is healthcare.
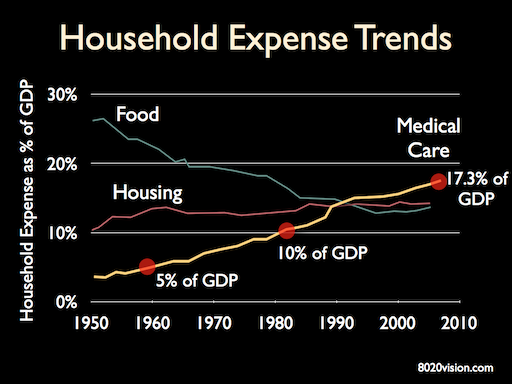
Healthcare, housing, food household expense as a share of GDP
(source: Congressional Budget Office)

Healthcare costs represent a stunning 17% of GDP. Politicians that cut taxes without a plan for how to cover the costs of Medicare are dooming the middle class to a future of just working to pay for out of control medical costs.

With the Income Inequality Gap growing, perhaps we can understand why, during the 2010 midterm election, only 40 percent of voters approved of an extension of all Bush tax cuts.

Measuring Income Inequality: The Gini Index

No society can sustain itself without a healthy middle class. No healthy society ignores it’s poor. As income inequality increases, social stability decreases.

Economists, the US Department of Labor, and analysts at the CIA, track Income Inequality using a metric known as the Gini Index (also known as the Gini Coefficient).

It is one of the essential metrics in the Political Instability Index, which is used to assess the level of threat posed to governments by social unrest. Zimbabwe, Chad and Congo rank most unstable, with Canada, Denmark, and Norway ranking most stable. Notably, the US, once the standard-setter of a stable democracy and middle class, has quickly fallen to an underwhelming rank 110 out of 165 countries.

The Gini Index is proportional to the Income Inequality of a nation. A Gini Index value of 0 indicates equal income for all earners. A Gini Index of 100 means that one person had all the income and nobody else had any.

A lower Gini Index indicates more equitable distribution of wealth in a society, while higher Gini Coefficients mean that wealth is concentrated in the hands of fewer people. Societies with high Gini Index tend to be unstable.

The chart below shows the historic trend of the Gini Index for the US, with tax rate and pre-tax income data for the top 1% of US earners in the background. On the right are various countries, with their associated Gini Index. Developed nations that take care of their own tend to have Gini indexes in the twenties and 30s. The US Gini Index is on track to breach 50 by the end of the decade, putting the US in the dubious country club of third world dictatorships and failing nations.
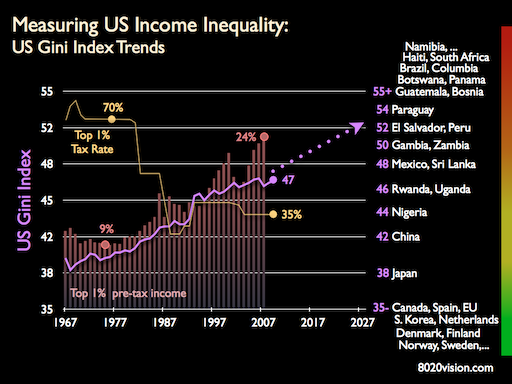
US Gini Index trend, with top 1% tax rate and pre-tax income
(source: US Department of Labor, CIA World Factbook, IRS)

If you are a business leader, ask yourself, “Do I want to be living and building a business in world like that?”  If the answer is NO, think about what public policy you are supporting through your contributions to politicians, associations and the Chamber of Commerce. Are the politicians you are supporting interested in a healthy middle class?

Business paid billions of dollars to politicians in the 2010 election. Paraphrasing W. W. Jacobs in his classic cautionary tale, The Monkey’s Paw, “Be careful what you wish for, you might get it.

the monkeys paw

Recommended Reading

Winner-Take-All Politics by Jacob S. Hacker and Paul Pierson

Richistan by Robert Frank

The Spirit Level by Richard Wilkinson and Kate Pickett

The Monkey’s Paw By W.W. Jacobs

The Tyranny of Dead Ideas by Matt Miller

Rethinking the Measure of Growth by Jay Kimball

Nobel Laureate Joseph Stiglitz on Sustainability and Growth by Jay Kimball

The Bush Tax Cuts and the Economy by The Congressional Research Service

Prosperity Without Growth

Keywords: smart growth, sustainable growth, sustainable business, Edward D. Hess, Strategy+Business

In the latest issue of Strategy and Business, David K. Hurst reviews Smart Growth by Edward D. Hess. The review is below. For more on growth and sustainability see:

Nobel Laureate Joseph Stiglitz on Sustainability and Growth

Prosperity without Growth: A review of Smart Growth by Edward D. Hess

Edward D. Hess, professor of business administration and Batten Executive-in-Residence at the University of Virginia’s Darden School of Business, has a heretical thought: Growth may not be good. In Smart Growth, he questions the four major assumptions behind the conventional wisdom of corporate success, which he calls the “growth mental model” (GMM): that businesses must grow or die, that growth is unequivocally good, that growth should be smooth and continuous, and that quarterly earnings are the primary measure of success. In addition, he supplies a series of trenchant questions for managers to ask themselves about how, why, and even whether their firms should grow.

In nine crisp chapters, Hess demonstrates that the GMM is neither possible in practice nor feasible in theory, and that attempts to meet its demands can create insurmountable obstacles to corporate sustainability. His arguments are supported by a series of case studies showing that growth is usually uneven and episodic — impossible to sustain for more than relatively short periods of time. Thus, attempts to “implement” the GMM result either in profitless growth, especially through acquisitions, or in ersatz earnings produced via a wide variety of financial manipulations. To test whether the concept of the GMM is supported by theoretical perspectives on growth, Hess turns to economics, organizational strategy and design, and biology. He finds that neoclassical economics is the framework that is most sympathetic to the GMM, but its assumptions do not hold up in the real world; that the strategic and design perspective offers little support for the GMM; and that biological theories are notable for the stress they put on the limits to growth. So there is little support for the conventional wisdom in theory.

Hess’s conclusion is that corporations should aim for sustainable or “smart” growth by asking some key questions, especially regarding the resources most needed to support such growth. Following economist Edith Penrose’s resource-based theory of the firm, he contends that the true limit to growth is usually defined by the capabilities of the firm’s managers — supporting this argument with the well-documented case of Starbucks’s overreach, in which the rapid expansion in the number of stores caused liabilities to rise precipitously and diluted the value of the brand.

All this makes good sense. The only shortcoming may be the author’s failure to examine why the GMM is so robust in the face of all the evidence against it. Is it because there are large constituencies in the economy that generate revenue by pushing the GMM and thriving on the turmoil it creates? If so, is there a need for public policy addressing it? And what risks do firms run if they eschew the flawed GMM in favor of smart growth?

Author Profile:

David K. Hurst is a contributing editor of strategy+business. His writing has also appeared in the Harvard Business Review, the Financial Times, and other leading business publications. Hurst is the author of Crisis & Renewal: Meeting the Challenge of Organizational Change (Harvard Business School Press, 2002).

Reprinted with permission from the strategy+business website. Copyright 2010 by Booz & Company. All rights reserved. www.strategy-business.com

More on Smart Growth at Amazon.com

Recommended Reading: The Coming Famine

Keywords: Julian Cribb, The Coming Famine, food, water, population, climate change

If you are a regular reader of this blog, you know that we track several core issues that we believe will have profound impact on us all – rich and poor, individuals, communities, business, and government. They are population, energy, water, food, climate change and healthcare. In a sense, food interrelates to all the other issues – it takes tremendous energy and water to produce our food, climate change will reduce food production, and food choices affect our health.

An excellent new book has just been published that clearly and concisely lays out the global food challenges unfolding around us and details what to do about it. The book is The Coming Famine: The Global Food Crisis and What We Can Do to Avoid It by Julian Cribb. The NY Times has an excellent excerpt and leads with this compelling quote:

Lo que separa la civilización de la anarquía son solo siete comidas.
(Civilization and anarchy are only seven meals apart.)

—Spanish proverb

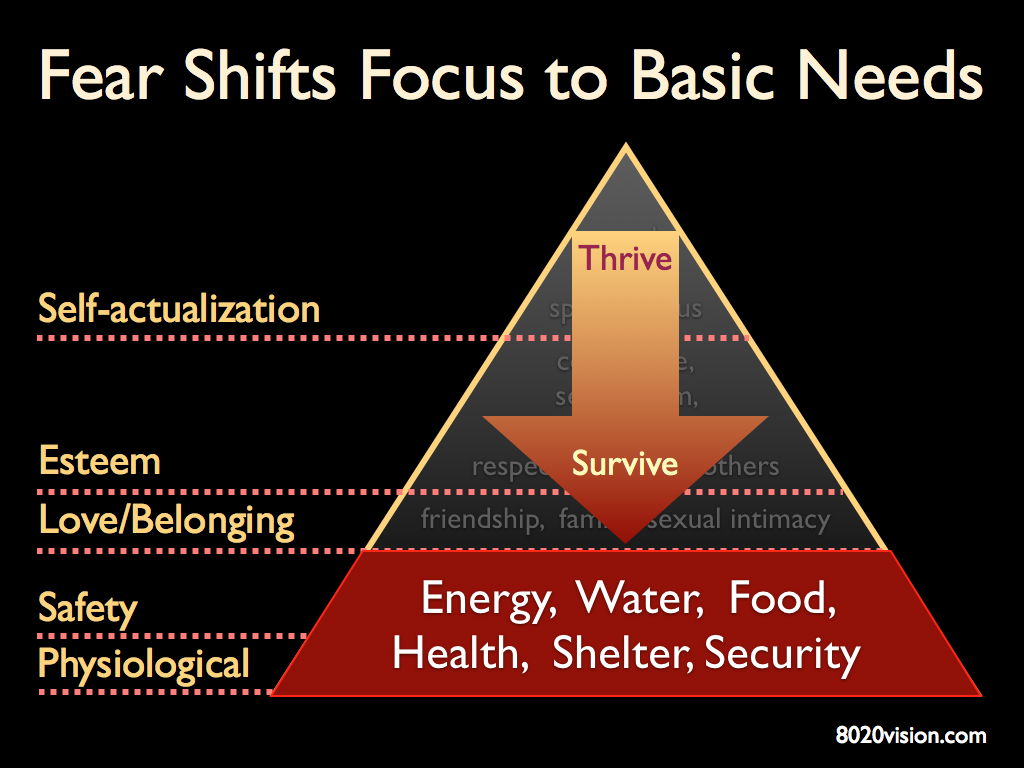
Food, water, shelter and security are the fundamental building blocks of  a persons survival. When those basics are removed, even for a few days, a civilized population can move toward anarchy in a heartbeat.

Maslow's Hierarchy of Needs - from thrive to survive

Rather than highlight the NY Times excerpt, I think it is worth looking at the solid concise description Cribb provides, of the main drivers challenging the supply and demand sides of food production. If you read nothing else in this book, read this and remember it as you  try to make sense of the news stories realted to food that will become more common as the crisis deepens.

Excerpt of The Coming Famine by Julian Cribb

To see where the answers may lie, we need to explore each of the main drivers. On the demand side the chief drivers are:

Population. Although the rate of growth in human numbers is slowing, the present upward trend of 1.5 percent (one hundred million more people) per year points to a population of around 9.2 billion in 2050 — 3 billion more than in 2000. Most of this expansion will take place in poorer countries and in tropical/subtropical regions. In countries where birth rates are falling, governments are bribing their citizens with subsidies to have more babies in an effort to address the age imbalance.

Consumer demand. The first thing people do as they climb out of poverty is to improve their diet. Demand for protein foods such as meat, milk, fish, and eggs from consumers with better incomes, mainly in India and China but also in Southeast Asia and Latin America, is rising rapidly. This in turn requires vastly more grain to feed the animals and fish. Overfed rich societies continue to gain weight. The average citizen of Planet Earth eats one-fifth more calories than he or she did in the 1960s — a “food footprint” growing larger by the day.

Population and demand. This combination of population growth with expansion in consumer demand indicates a global requirement for food by 2050 that will be around 70–100 percent larger than it is today. Population and demand are together rising at about 2 percent a year, whereas food output is now increasing at only about 1 percent a year.

These demand-side factors could probably be satisfied by the world adopting tactics similar to those of the 1960s, when the Green Revolution in farming technology was launched, were it not for the many constraints on the supply side that are now emerging to hinder or prevent such a solution:

Water crisis. Put simply, civilization is running out of freshwater. Farmers presently use about 70 percent of the world’s readily available freshwater to grow food. However, increasingly megacities, with their huge thirst for water for use in homes, industry, and waste disposal, are competing with farmers for this finite resource and, by 2050, these uses could swallow half or more of the world’s available freshwater at a time when many rivers, lakes, and aquifers will be drying up. Unless major new sources or savings are found, farmers will have about half of the world’s currently available freshwater with which to grow twice the food.

Land scarcity. The world is running out of good farmland. A quarter of all land is now so degraded that it is scarcely capable of yielding food. At the same time, cities are sprawling, smothering the world’s most fertile soil in concrete and asphalt, while their occupants fan out in search of cheap land for recreation that diverts the best food-producing areas from agriculture. A third category of land is poisoned by toxic industrial pollution. Much former urban food production has now ceased. The emerging global dearth of good farmland represents another severe limit on increasing food production.

Nutrient losses. Civilization is hemorrhaging nutrients — substances essential to all life. Annual losses in soil erosion alone probably exceed all the nutrients applied as fertilizer worldwide. The world’s finite nutrient supplies may already have peaked. Half the fertilizer being used is wasted. In most societies, up to half the food produced is trashed or lost; so too are most of the nutrients in urban waste streams. The global nutrient cycle, which has sustained humanity throughout our history, has broken down.

Energy dilemma. Advanced farming depends entirely on fossil fuels, which are likely to become very scarce and costly within a generation. At present farmers have few alternative means of producing food other than to grow fuel on their farms — which will reduce food output by 10–20 percent. Many farmers respond to higher costs simply by using less fertilizer or fuel — and so cutting yields. Driven by high energy prices and concerns about climate change, the world is likely to burn around 400 million tonnes (441 million U.S. tons) of grain as biofuels by 2020 — the equivalent of the entire global rice harvest.

Oceans. Marine scientists have warned that ocean fish catches could collapse by the 2040s due to overexploitation of wild stocks. Coral reefs — whose fish help feed about five hundred million people — face decimation under global warming. The world’s oceans are slowly acidifying as carbon dioxide from the burning of fossil fuels dissolves out of the atmosphere, threatening ocean food chains. Fish farms are struggling with pollution and sediment runoff from the land. The inability of the fish sector to meet its share of a doubling in world food demand will throw a heavier burden onto land-based meat industries.

Technology. For three de cades the main engine of the modern food miracle, the international scientific research that boosted crop yields, has been neglected, leading to a decline in productivity gains. Farmers worldwide are heading into a major technology pothole, with less new knowledge available in the medium run to help them to increase output.

Climate. The climate is changing: up to half the planet may face regular drought by the end of the century. “Unnatural disasters” — storms, floods, droughts, and sea-level rise — are predicted to become more frequent and intense, with adventitious impacts on food security, refugee waves, and conflict.

Economics, politics, and trade. Trade barriers and farm subsidies continue to distort world markets, sending the wrong price signals to farmers and discouraging investment in agriculture and its science. The globalization of food has helped drive down prices received by farmers. Speculators have destabilized commodity markets, making it riskier for farmers to make production decisions. Some countries discourage or ban food exports and others tax them, adding to food insecurity. Others pay their farmers to grow fuel instead of food. A sprawling web of health, labor, and environmental regulation is limiting farmers’ freedom to farm.

The collapse in world economic conditions in late 2008 and 2009 has changed the prices of many things, including land, food, fuel, and fertilizer — but has not altered the fact that demand for food continues to grow while limits on its production multiply. Indeed, the economic crash exacerbated hunger among the world’s poor, and has not altered the fundamentals of climate change, water scarcity, population growth, land degradation, or nutrient or oil depletion.

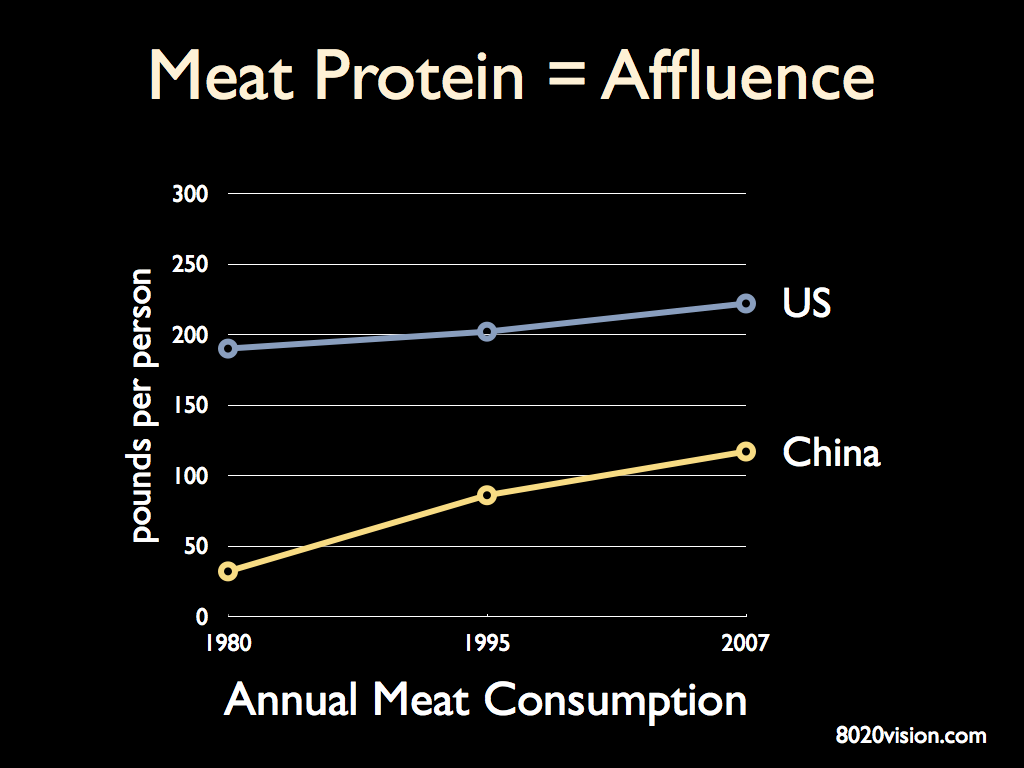
As Cribb astutely points out, as developing nations become more affluent, they consume more protein, in the form of fish, meat, milk, eggs, etc.

Meat Protein Consumption in US and China
(source: US Department of Agriculture)

That protein is produced with grain, and it is an inefficient process:

  • It takes 1,ooo tons of water to produce a ton of grain
  • It takes about 15 pounds of grain to produce a pound of beef
  • It takes about 5,200 gallons of water to produce a pound of beef

Thinking about the Butterfly Effect – the idea that a butterfly flapping its wings in one part of the world, changing patterns in the air, can cause a tornado in another part of the world – we can see that famine in one part of the world becomes a kind of super butterfly. All nations – rich and poor – will feel the impact.

Cripp summarizes the challenge and frames the solution:

To sum it all up, the challenge facing the world’s 1.8 billion women and men who grow our food is to double their output of food — using far less water, less land, less energy, and less fertilizer. They must accomplish this on low and uncertain returns, with less new technology available, amid more red tape, economic disincentives, and corrupted markets, and in the teeth of spreading drought. Achieving this will require something not far short of a miracle.

Yet humans have done it before and, resilient species that we are, we can do it again. This time, however, it won’t just be a problem for farmers, scientists, and policy makers. It will be a challenge involving every single one of us, in our daily lives, our habits, and our influence at the ballot box and at the supermarket.

It will be the greatest test of our global humanity and our wisdom we have yet faced.

Consumer Behavior: Deleveraging

Roger Lowenstein, an outside director of the Sequoia Fund, and author of The End of Wall Street has an article in The New York Times called Paralyzed by Debt.

Highlights of the article are below. It is an excellent example of the impact uncertainty and consumer unease can have on consumer behavior. To put the article in context, here are a couple charts I use when talking about consumer behavior and impact on business and government economic models.

Maslow's Hierarchy of Needs

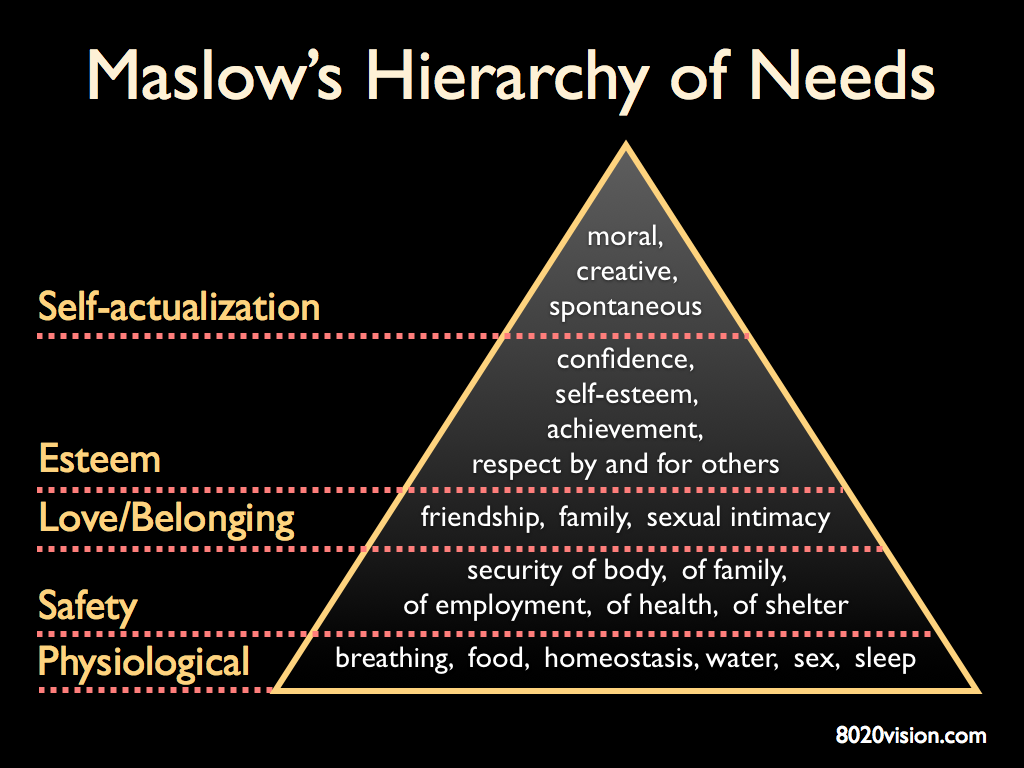
In Maslow’s hierarchy, the higher level needs can only be met when the foundational needs are solid. When something like the current recession, or high oil prices, or job insecurity occur, uncertainty rises and undermines our sense of wellbeing. We shift our focus to the basics – do we have a stable home situation, can we pay the mortgage, do we have a job, can we depend on it, can we afford healthcare, etc.? In short, the consumer mind shifts from Thrive to Survive.

Maslow's Hierarchy of Needs - from thrive to survive

We can see a practical example of this in the Personal Savings Rate.  As the US entered the 2008 recession, the Personal Saving Rate, which has been trending down, did a stunning reversal in a single quarter, pivoting from .8 percent to almost 6 percent.

Personal Saving Rate

Lowenstein details how economic uncertainty impacted refinancing his home.

Highlights from NY Times Article: Paralyzed by Debt

Last month, my wife and I refinanced our mortgage. Though the rate was lower and we could have afforded more debt, we paid down a chunk of the balance. Don’t ask me why — it just felt better to owe less money. Time was, such thrift would have been hailed as patriotic. Now it threatens the economic recovery. Less borrowing means less to spend.
Suppose everybody did this? Well, it turns out, everybody has. Eschewing trips to the mall, Americans are paying off credit-card balances and home-equity lines. Despite low rates, mortgage demand has plummeted.

  • 12.5% of household after-tax income is devoted to repaying debts (source: The Federal Reserve Board, 2010)
  • Half of American workers have suffered a job loss or a cut in hours or wages over the past 30 months.
  • The economy is Deleveraging. Credit in the economy is shrinking, as opposed to the normal state of affairs, in which, each quarter, people borrow more money and banks issue more loans.

Remarkably, this deleveraging has been going on for nearly two years. Ordinary Americans are behaving just as the banks they love to excoriate — having, formerly, assumed too much risk, they are going into hibernation. If credit, in the words of the writer James Grant, is money of the mind, people have become psychologically indisposed to minting it.

  • Total household credit has contracted for seven straight quarters.
  • Mortgage debt is down $462 billion from the peak, which it reached in November 2008.
  • Bank-card borrowings, which peaked two months later, are off $126 billion.
  • Auto loans have fallen $122 billion; home-equity lines, $77 billion.

As Stephanie Pomboy, publisher of the newsletter Macro Mavens, has pointed out, government transfers like stimulus spending and tax credits masked the effects of diminishing credit for a while. That is to say, even if people were unwilling to borrow, they were happy to spend money they got from the government. Now that government supports are being pulled away, the effects of deleveraging are in plain view. Home and car sales are plummeting again. Job growth has shrunk to a sliver. Personal bankruptcies are soaring. Deflation, a dangerous state of economic dead air, when prices fall from lack of demand, is a distinct possibility.

  • In 2001, household debt reached a par with annual after-tax household income. (The average family owed what it earned.) By the peak of the bubble, in 2008, borrowings had surged to 36 percent more than income.

Which raises the issue: how much of that debt will have to be repaid before people return to their customary, and stimulative, profligacy? Thus far, we have undone only a portion of the excess. Household debt now stands at 26 percent more than income — still very high by historical standards. “There is no magical level where it should be,” says David Resler, an economist with Nomura Securities. “There is no clear equilibrium.”

  • To return to the status quo of before the housing boom — say, back to debt to income ratios prevailing in 2000 — it would take five more years of deleveraging at the current rate.

McKinsey recently published an excellent review of the global deleveraging process that began in 2008.  From their report:

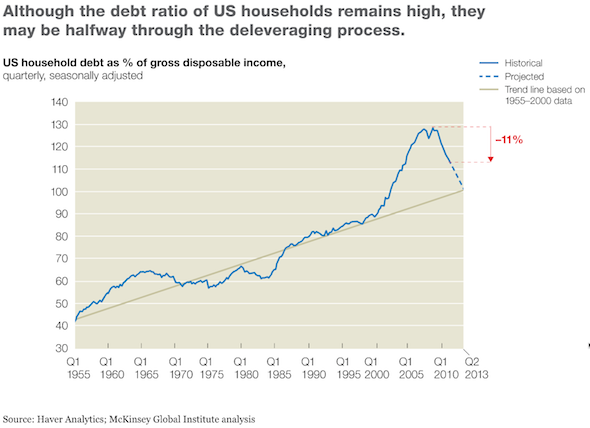
Americans steadily increased their debt levels for a good six decades, but it wasn’t until the turn of the millennium that the ratio of household debt to income really soared. Yet by the second quarter of 2011, three years after the start of the global economic crisis, the US ratio had fallen 11 percent from its peak. At the current rate of deleveraging, it would return to trend as of mid-2013—a conclusion buttressed by a comparison between US households today and those of Sweden and Finland during the 1990s, when the two Scandinavian countries endured similar banking crises, recessions, and deleveraging episodes. In both, the ratio of household debt to income fell by roughly 30 percent from its peak. As the exhibit below shows, the United States has been closely tracking the Swedish experience, while households in Spain and the United Kingdom have only just begun to deleverage. To learn more, read “Working out of debt” (January 2012).

US deleveraging - US household debt as percent of gross disposable income

global deleveraging - US, UK, Spain, Sweden

Sustainable Energy Security: Strategic Risks and Opportunities for Business

Lloyds of London, the insurance market, and Chatham House have published a white paper on Sustainable Energy Security that details the risks and opportunities for business.

Lloyd’s CEO, Dr. Richard Ward, doesn’t mince words in his foreword to the white paper:

This report, jointly produced by Lloyd’s 360 Risk Insight programme and Chatham House, should cause all risk managers to pause. What it outlines, in stark detail, is that we have entered a period of deep uncertainty in how we will source energy for power, heat and mobility, and how much we will have to pay for it.

Is this any different from the normal volatility of the oil or gas markets? Yes, it is. Today, a number of pressures are combining: constraints on ‘easy to access’ oil; the environmental and political urgency of reducing carbon dioxide emissions; and a sharp rise in energy demand from the Asian economies, particularly China.

All of this means that the current generation of business leaders – and their successors – are going to have to find a new energy paradigm. Expect dramatic changes:

  • Prices are likely to rise, with some commentators suggesting oil may reach $200 a barrel.
  • Regulations on carbon emissions will intensify.
  • Reputations will be won or lost as the public demands that businesses reduce their environmental footprint.

The growing demand for energy will require an estimated $26 trillion in investment by 2030. Energy companies will face hard choices in deciding how to deploy these funds in an uncertain market with mixed policy messages. The recent Deepwater oil spill shows all too clearly the hazards of moving into ever more unpredictable terrain to extract energy resources. And the rapid deployment of cleaner energy technologies will radically alter the risk landscape. At this precise point in time we are in a period akin to a phony war. We keep hearing of difficulties to come, but with oil, gas and coal still broadly accessible – and largely capable of being distributed where they are needed – the bad times have not yet hit. The primary purpose of this report is to remind the reader that all businesses, not just the energy sector, need to consider how they, their suppliers and their customers will be affected by energy supplies which are less reliable and more expensive.

The failure of the Copenhagen Summit has not helped to instil a sense of urgency and it has hampered the ability of businesses – particularly those in the energy sector – to plan ahead and to make critical new investments in energy infrastructure. I call on governments to identify a clear path towards sustainable energy which businesses can follow.

Independently of what happens in UN negotiating rooms, businesses can take action. We can plan our energy needs, we can make every effort to reduce consumption, and we can aim for a mix of different energy sources. The transformation of the energy environment from carbon to clean energy sources creates an extraordinary risk management challenge for businesses. Traditional models that focus on annual profits and, at best, medium term strategies may struggle. Parts of this report talk about what might happen in 2030 or even 2050 and I make no apology for this. Energy security requires a long term view and it is the companies who grasp this who will trade on into the second half of this century.

Executive Summary

  • Businesses which prepare for and take advantage of the new energy reality will prosper – failure to do so could be catastrophic.
  • Market dynamics and environmental factors mean business can no longer rely on low cost traditional energy sources.
  • China and growing Asian economies will play an increasingly important role in global energy security
  • We are heading towards a global oil supply crunch and price spike.
  • Energy infrastructure will become increasingly vulnerable as a result of climate change and operations in harsher environments.
  • Lack of global regulation on climate change is creating an environment of uncertainty for business, which is damaging investment plans.
  • To manage increasing energy costs and carbon exposure businesses must reduce fossil fuel consumption.
  • Business must address energy-related risks to supply chains and the increasing vulnerability of ‘just-in-time’ models.
  • Investment in renewable energy and ‘intelligent’ infrastructure is booming. This revolution presents huge opportunities for new business partnerships.

A change in the energy market balance between East and West

Advanced economies remain the biggest consumers of primary energy per person but by 2008 non-OECD countries led by China and India had outstripped them in terms of the share of world demand. This shift began in the 1990s, partly because manufacturing shifted eastwards. Meanwhile, lower population growth, de- industrialisation, greater efficiency, higher fuel prices and a concern for the environment are lowering demand for oil-based fuels and coal in the OECD.

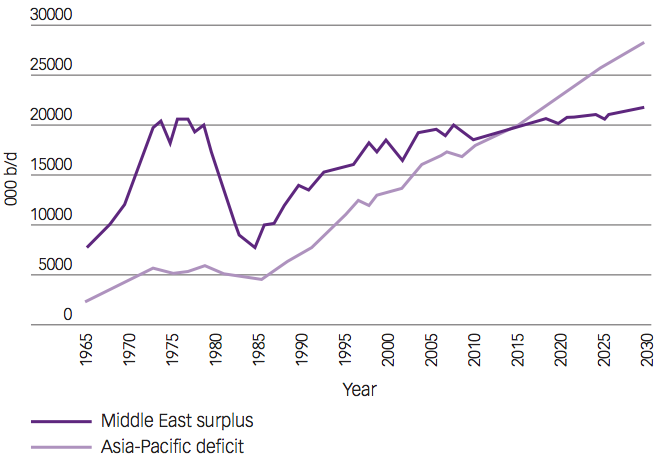
These consumption trajectories mean there is likely to be a tipping point in 2015 when countries in Asia-Pacific need more imported oil in total than the Middle East (including Sudan) can export.

Middle East oil surplus vs Asia-Pacific deficit
Middle East oil surplus vs Asia-Pacific deficit (Source: John Mitchell, Chatham House 2010)

The white paper goes on to detail market forces, energy trends, risk and opportunity.  This is recommended reading for business and government leaders and risk managers.

China: The Next Superconsumer?

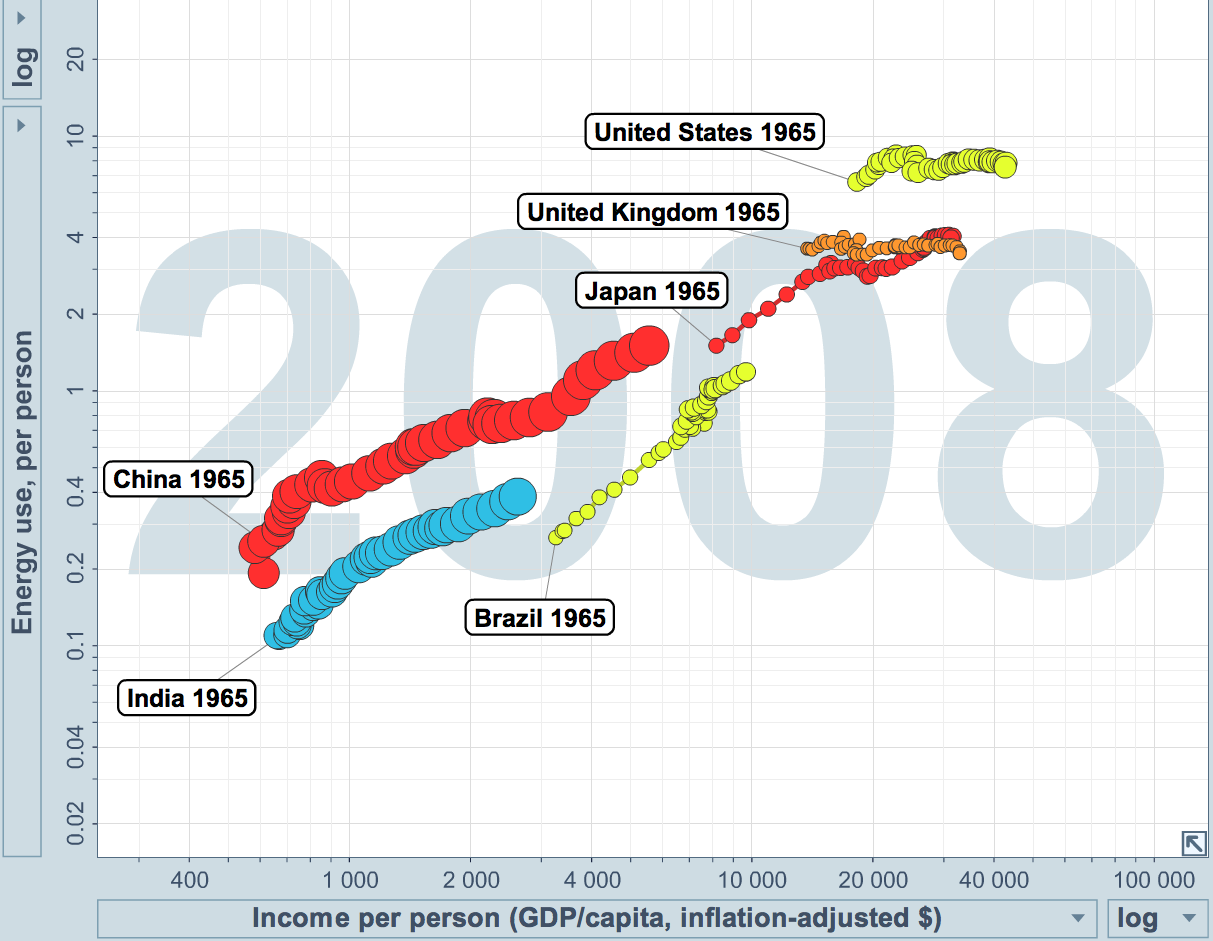
There’s a good article in the Guardian that builds on data I presented last week in the article The Real Population Problem. One of the my charts shows the growing per capita income and consumptions patterns in China. As the population has grown, per capita income and consumption have grown. Using GapMinder’s Trendalyzer with energy consumption data from BP’s Statistical Review of World Energy 2010 and income data from the IMF, we can see some powerful trends unfolding (N.B. data presented for 1965 through 2008, 1 year steps, circle area proportional to population size, energy use in tonnes of oil equivalent):

Regional Energy Consumption and Income Trends
As income rises so does consumption – of commodities like energy, as well as retail goods.

Income has flattened in the US and Europe, and people are spending less and saving more.  For global retailers, China’s growing per capita income is attracting businesses that cater to the “consumer.”

Highlights of the Guardian article:

  • The fastest-growing consumer class in China are single women. They have high levels of disposable income and a craving for designer labels.
  • State planners forecast that half the population will rise to the “middle class” by 2020.
  • As China’s consumer population rises, 4.5 more earths will be required to feed the need.
  • Shanghai, the second busiest port in the world, is the beachhead for retail giants like Kentucky Fried Chicken (2,000 outlets in china), McDonald’s, Starbucks, Louis Vuitton, Gucci and Chanel, Wal-Mart, Carrefour, Tesco and Ito Yokado.
  • Mattel, the world’s biggest toy company, marked the Barbie doll’s 50th birthday by opening the world’s largest Barbie emporium.
  • China is now seeing a surge in obesity, diabetes and heart disease. Obese children used to be rare in China; now nearly 15% of the population is overweight.
  • To feed its growing livestock, China imports huge quantities of soya, much of it from Brazil, which has resulted in accelerated clearance of Amazonian forest and Cerrado savanna
  • In Shanghai, the average carbon dioxide emissions of its residents have already overtaken those in Tokyo, New York and London.

The Guardian article is an edited extract from When A Billion Chinese Jump by Jonathan Watts.