Examining the Relationship Between Growth and Prosperity

Most cities in the U.S. have operated on the assumption that growth is inherently beneficial and that more and faster growth will benefit local residents economically. Local growth is often cited as the cure for urban ailments, especially the need for local jobs. But does the empirical evidence show that growth is actually providing these benefits?

To test claims about the benefits of local growth, I examined the relationship between growth and prosperity in US metro areas. This study looked at the 100 largest US metro areas (representing 66% of the total US population) using the latest federal data for the 2000-09 period. The average annual population growth rate of each metro area was compared with unemployment rate, per capita income, and poverty rate using graphical and statistical analysis.

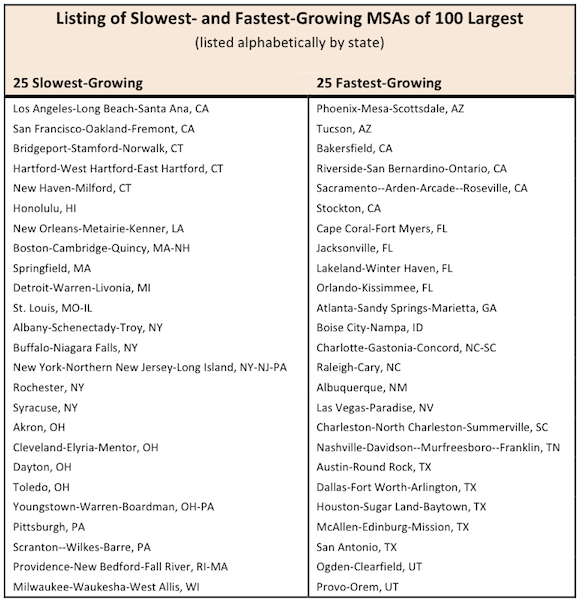
Listing of Slowest and Fastest Growing MSAs of 100 Largest

The “conventional wisdom” that growth generates economic and employment benefits was not supported by these data. The study found that those metro areas that have fared the best had the lowest growth rates. Even metro areas with stable or declining populations tended to fare better than fast-growing areas in terms of basic measures of economic well-being.

Some of the remarkable findings:

  • Faster-growing areas did not have lower unemployment rates.
  • Faster-growing areas tended to have lower per capita income than slower-growing areas. Per capita income in 2009 tended to decline almost $2,500 for each 1% increase in growth rate.
  • Residents of faster-growing areas had greater income declines during the recession.
  • Faster-growing areas tended to have higher poverty rates.

The 25 slowest-growing and 25 fastest-growing areas were compared. The 25 slowest-growing metro areas outperformed the 25 fastest-growing in every category and averaged $8,455 more in per capita personal income in 2009. They also had lower unemployment and poverty rates.

Comparison of 25 Fastest and 25 Slowest Growing Metro Areas of 100 Largest for the 2000 - 2009 Period

Another remarkable finding is that stable metro areas (those with little or no growth) did relatively well. Statistically-speaking, residents of an area with no growth over the 9-year period tended to have 43% more income gain than an area growing at 3%/year. Undoubtedly this offers a ray of hope that stable, sustainable communities may be perfectly viable — even prosperous — within our current economic system.
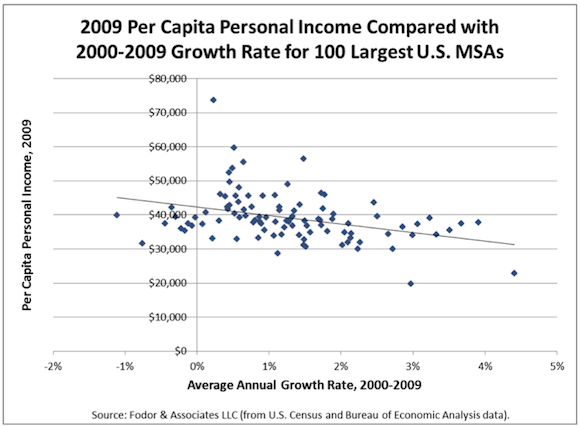
Per Capita Income versus Growth Rate Chart top 100 MSAs

While certain businesses prosper from growth, apparently the balance of the community does not. The statistics showing that fast-growing areas tend to have lower and declining incomes, indicate that any gains by the businesses that directly benefit from growth are more than offset by losses to the rest of the local population. In other words, a small segment of the local population may benefit from faster growth, but the larger population tends to see their prosperity decline.

This study was not an attempt to explain all the complex relationships that exist, but merely to test whether there is a correlation between growth and some of the benefits that are so often attributed to it. More research is clearly needed on this important topic.

Population growth tends to be directly linked to urban growth. There is a close, linear relationship between the two, as more people require more housing units and more commercial buildings for employment and shopping.

Public policies and plans regarding urban growth typically involve tradeoffs between economic, environmental, and social impacts. Local residents may view a policy to encourage land development or growth as negatively impacting their quality of life through increased traffic congestion, environmental quality impacts, loss of farm and forest lands, and loss of amenity values (such as tranquility, sense of community, and open space). They may also be concerned about higher taxes to fund the cost of the new public infrastructure (roads, schools, sewer and water systems, etc.) required to serve growth. However, the prospect that new growth will bring jobs and economic prosperity that may benefit local residents is often viewed as compelling enough to outweigh these costs.

So if growth is actually not providing these benefits, then the decision-making balance shifts towards the fiscal, environmental, and quality-of-life impacts. With greater awareness of the relationship between growth and prosperity, perhaps we will see a shift in our focus toward making our cities better places, not just bigger places.

Most US cities have been actively pursuing growth with all the policy and financial tools at their disposal under the presumption that they are fostering local prosperity. As US cities seek a path out of the recession, this study suggests that new economic development strategies will be needed that do not rely so heavily on growth. ###

To read the full study, see: Relationship between Growth and Prosperity in 100 Largest U.S. Metropolitan Areas by Eben Fodor

Eben Fodor is the Principal of Fodor & Associates, a consulting firm based in Eugene, Oregon specializing in studying the fiscal, economic, and environmental impacts of urban growth and land development. This independent research was funded by Fodor & Associates as a public service.

Recommended Reading

Nobel Laureate Joseph Stiglitz on Sustainability and Growth by Jay Kimball
GOP Rep. Bob Inglis On Climate Change

Watch this video. It’s encouraging to see a Republican politician take a risk, saying climate change is a serious problem and the US needs to become a leader in innovating solutions.

Yesterday morning, at a House subcommittee hearing on climate change, outgoing Republican representative Bob Inglis challenged his Republican colleagues to stop mocking scientists, get busy tackling climate change, and put the US in a leadership position on innovating solutions.

From Think Progress

A ThinkProgress analysis found that 50 percent of the incoming freshman GOP class deny the existence of manmade climate change, while a shocking 86 percent are opposed to any legislation to address climate change that increases government revenue. Meanwhile, all of the Republicans vying to chair the House Energy Committee — which handles climate and energy issues — in the new Congress are climate change deniers. They include Rep. Joe Barton (R-TX), who infamously apologized to BP shortly after the company’s catastrophic oil spill in the Gulf of Mexico this summer.

Here’s the transcript of Rep. Bob Inglis remarks, to the House subcommittee hearing on climate change

I’m very excited to be here Mr. Chairman, because this is on the record. And it’s a wonderful thing about Congressional hearings — they’re on the record. Kim Beaszley who’s Australia’s ambassador to the United States tells me that when he runs into a climate skeptic, he says to them, “Make sure to say that very publicly, because I want our grandchildren to read what you said and what I said. And so, we’re on the record, and our grandchildren, or great-grandchildren, are going to read. And so some are here suggesting to those children that here’s a deal: Your child is sick — this is what Tom Friedman gave me this great analogy yesterday — Your child is sick. 98 doctors say treat him this way. Two say no, this other way is the way to go. I’ll go with the two. You’re taking a big risk with those kids. Because 98 of the doctors say, “Do this thing,” two say, “Do the other.” So, it’s on the record.

And we’re here with important decision to be made. And I would also suggest to my Free Enterprise colleagues — especially conservatives here — whether you think it’s all a bunch of hooey, what we’ve talked about in this committee, the Chinese don’t. And they plan on eating our lunch in this next century. They plan on innovating around these problems, and selling to us, and the rest of the world, the technology that’ll lead the 21st century. So we may just press the pause button here for several years, but China is pressing the fast-forward button. And as a result, if we wake up in several years and we say, “geez, this didn’t work very well for us. The two doctors didn’t turn out to be so right. 98 might have been the ones to listen to.” then what we’ll find is we’re way behind those Chinese folks. ‘Cuz you know, if you got a certain number of geniuses in the population — if you’re one in a million in China, there’s 1300 of you. And you know what?

They plan on leading the future. So whether you — if you’re a free enterprise conservative here — just think: it’s a bunch of hooey, this science is a bunch of hooey. But if you miss the commercial opportunity, you’ve really missed something. And so, I think it’s great to be here on the record. I think it’s great to see the opportunity we’ve got ahead of us. And, I also — since this is sort of a swan song for me and Mr. Barrett I’d encourage scientists who are listening out there to get ready for the hearings that are coming up in the next Congress. Those will be difficult hearings for climate scientists. But, I would encourage you to welcome those as fabulous opportunities to teach.

Recommended Reading

Topic: Climate Change

When Does the Wealth of a Nation Hurt its Wellbeing?

With Bush-era tax cuts about to expire, a lot of attention is being focused on extending tax cuts for the rich – suggesting it will help the economy grow. Frank Rich, in his weekly op-ed piece at the New York Times, deconstructs that idea and examines the issue through the lens of income inequality.

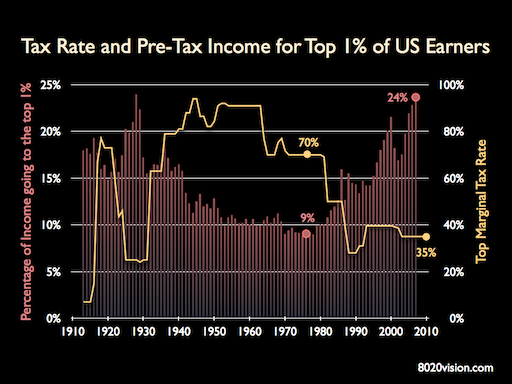
The top 1 percent of American earners now have tax rates half what they were in the 1970s. And they took in 23.5 percent of the nation’s pre-tax income in 2007 — up from less than 9 percent in 1976. During the boom years of 2002 to 2007, that top 1 percent’s pre-tax income increased an extraordinary 10 percent every year. In that same period, the average inflation-adjusted hourly wage went down more than 7 percent and the poverty rate rose.

Top 1% Tax Rate and pre-tax Income Trends
(source: IRS micro data, Piketty and Saez)

The rich have been getting richer as their tax rate has steadily eased. And they are taking the added wealth and using it to influence public policy, to the detriment of the middle class.

“How can hedge-fund managers who are pulling down billions sometimes pay a lower tax rate than do their secretaries?” ask the political scientists Jacob S. Hacker (of Yale) and Paul Pierson (University of California, Berkeley) in their deservedly lauded new book, Winner-Take-All Politics

…Inequality is instead the result of specific policies, including tax policies, championed by Washington Democrats and Republicans alike as they conducted a bidding war for high-rolling donors in election after election.

And as Frank Rich points out, the American Dream is not well. Rather than middle class wage earners moving up the ladder, there are less and less people becoming wealthy, and more and more of the wealthy simply becoming wealthier.

Nor are the superrich helping to further the traditional American business culture that inspires and encourages those with big ideas and drive to believe they can climb to the top. Robert Frank, the writer who chronicled the superrich in the book Richistan, recently analyzed the new Forbes list of the 400 richest Americans for The Wall Street Journal and found a “hardening of the plutocracy” and scant mobility. Only 16 of the 400 were newcomers — as opposed to an average of 40 to 50 in recent years — and they tended to be in industries like coal, natural gas, chemicals and casinos rather than forward-looking businesses involving the Green Economy, tech or biotechnology. This is “not exactly the formula for America’s vaunted entrepreneurial wealth machine,” Frank wrote.

Those in the higher reaches aren’t investing in creating new jobs even now, when the full Bush tax cuts remain in effect, so why would extending them change that equation? American companies seem intent on sitting on trillions in cash until the economy reboots. Meanwhile, the nonpartisan Congressional Budget Office ranks the extension of any Bush tax cuts, let alone those to the wealthiest Americans, as the least effective of 11 possible policy options for increasing employment.

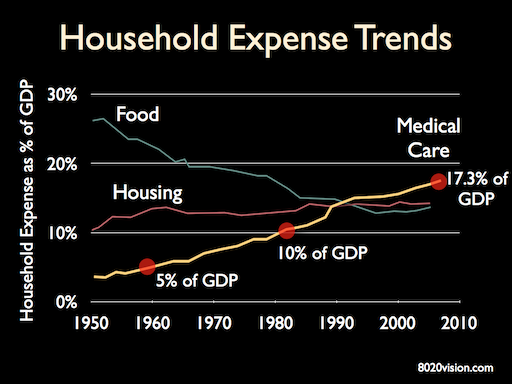
The middle class is experiencing the twin stress of falling income and increasing expenses. The most significant household expense is healthcare.

Healthcare, housing, food household expense as a share of GDP
(source: Congressional Budget Office)

Healthcare costs represent a stunning 17% of GDP. Politicians that cut taxes without a plan for how to cover the costs of Medicare are dooming the middle class to a future of just working to pay for out of control medical costs.

With the Income Inequality Gap growing, perhaps we can understand why, during the 2010 midterm election, only 40 percent of voters approved of an extension of all Bush tax cuts.

Measuring Income Inequality: The Gini Index

No society can sustain itself without a healthy middle class. No healthy society ignores it’s poor. As income inequality increases, social stability decreases.

Economists, the US Department of Labor, and analysts at the CIA, track Income Inequality using a metric known as the Gini Index (also known as the Gini Coefficient).

It is one of the essential metrics in the Political Instability Index, which is used to assess the level of threat posed to governments by social unrest. Zimbabwe, Chad and Congo rank most unstable, with Canada, Denmark, and Norway ranking most stable. Notably, the US, once the standard-setter of a stable democracy and middle class, has quickly fallen to an underwhelming rank 110 out of 165 countries.

The Gini Index is proportional to the Income Inequality of a nation. A Gini Index value of 0 indicates equal income for all earners. A Gini Index of 100 means that one person had all the income and nobody else had any.

A lower Gini Index indicates more equitable distribution of wealth in a society, while higher Gini Coefficients mean that wealth is concentrated in the hands of fewer people. Societies with high Gini Index tend to be unstable.

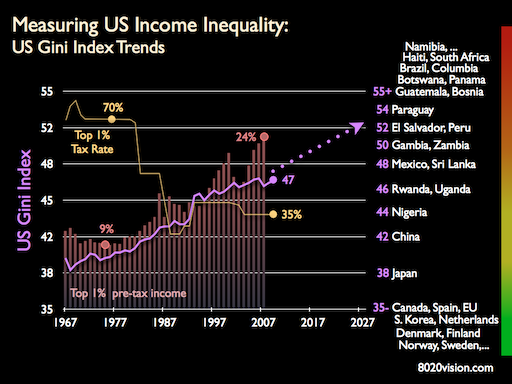
The chart below shows the historic trend of the Gini Index for the US, with tax rate and pre-tax income data for the top 1% of US earners in the background. On the right are various countries, with their associated Gini Index. Developed nations that take care of their own tend to have Gini indexes in the twenties and 30s. The US Gini Index is on track to breach 50 by the end of the decade, putting the US in the dubious country club of third world dictatorships and failing nations.

US Gini Index trend, with top 1% tax rate and pre-tax income
(source: US Department of Labor, CIA World Factbook, IRS)

If you are a business leader, ask yourself, “Do I want to be living and building a business in world like that?”  If the answer is NO, think about what public policy you are supporting through your contributions to politicians, associations and the Chamber of Commerce. Are the politicians you are supporting interested in a healthy middle class?

Business paid billions of dollars to politicians in the 2010 election. Paraphrasing W. W. Jacobs in his classic cautionary tale, The Monkey’s Paw, “Be careful what you wish for, you might get it.

the monkeys paw

Recommended Reading

Winner-Take-All Politics by Jacob S. Hacker and Paul Pierson

Richistan by Robert Frank

The Spirit Level by Richard Wilkinson and Kate Pickett

The Monkey’s Paw By W.W. Jacobs

The Tyranny of Dead Ideas by Matt Miller

Rethinking the Measure of Growth by Jay Kimball

Nobel Laureate Joseph Stiglitz on Sustainability and Growth by Jay Kimball

The Bush Tax Cuts and the Economy by The Congressional Research Service

California’s Prop 23 Morphing into Prop 26

In California’s election, voter support for Prop 23 is waning. That’s good news, but the fight is not over. If you didn’t like Prop 23, you’re really not going to like Prop 26. Out of state Big Oil was backing Prop 23, and, seeing that as a lost cause, they are shifting their support to Prop 26.

Prop 26 is another Big Oil backed initiative. Prop 26 would make it more difficult for state and local government to impose mitigation fees on business activities that cause harm to the environment or public health and safety. For example, fees imposed on tobacco companies to fund health-related programs, on industries for toxic waste cleanup and on alcohol retailers for law enforcement. In other words, when companies do us harm, through increased pollution, health risk, toxic waste, and crime, Prop 26 shifts the cost of those problems to the tax payer, and away from those businesses that caused the problem.

It’s all about AB32

Prop 23 was all about gutting California’s AB32 law, which requires the state to cut emissions of carbon dioxide and other greenhouse gases 25 percent by 2020.

So what are oil companies worried about? Why are the pumping tens of millions of dollars into Prop 23 and Prop 26 initiatives?

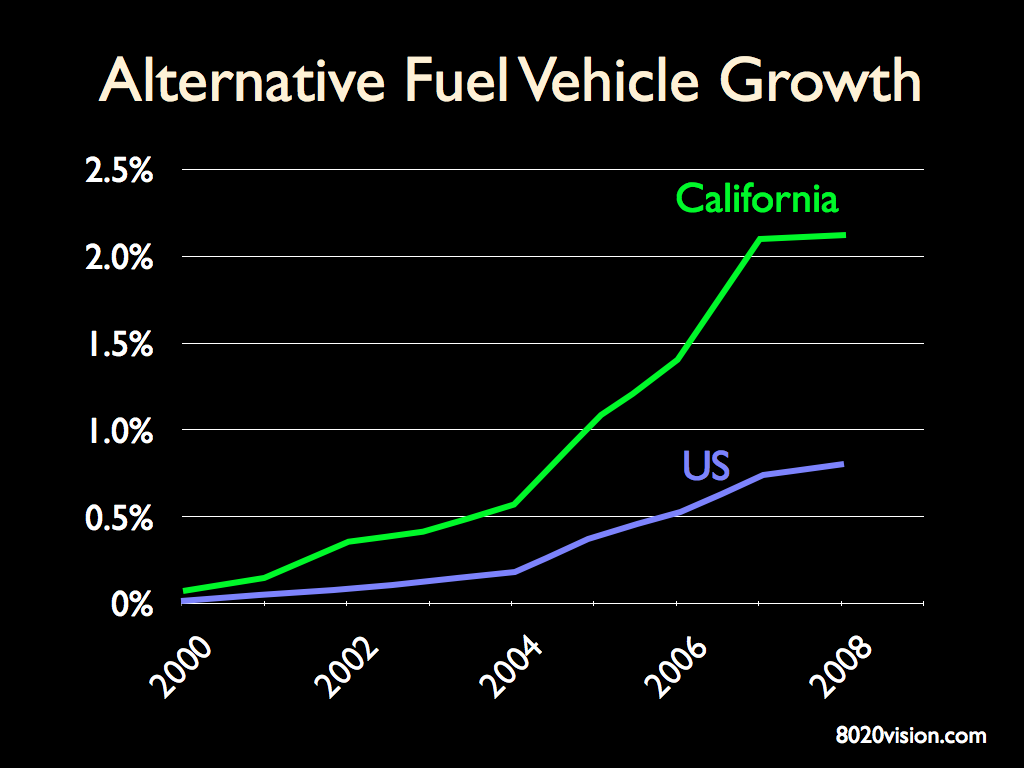
As the chart below shows, California is on the front line in the transition to alternative fuel vehicles. The US consumes more oil for transportation, than anything else. No state is making the transition to alternative fuels faster than California.

Alternative Fuel Vehicles Growth in California
Alternative fuel vehicles as share of all newly registered vehicles. (Source: RL Pike & Co.)

While AB32 is bad news for out of state Big Oil, it’s good news for California’s cleantech industry and general economic and environmental health of the state. It creates new cleantech jobs and positions California to be a global leader in this emerging industry. And it’s good news for the world, which will benefit from California’s cleantech innovations, much the way it did with decades of hi-tech chip, computer and communications innovations that put Silicon Valley on the map.

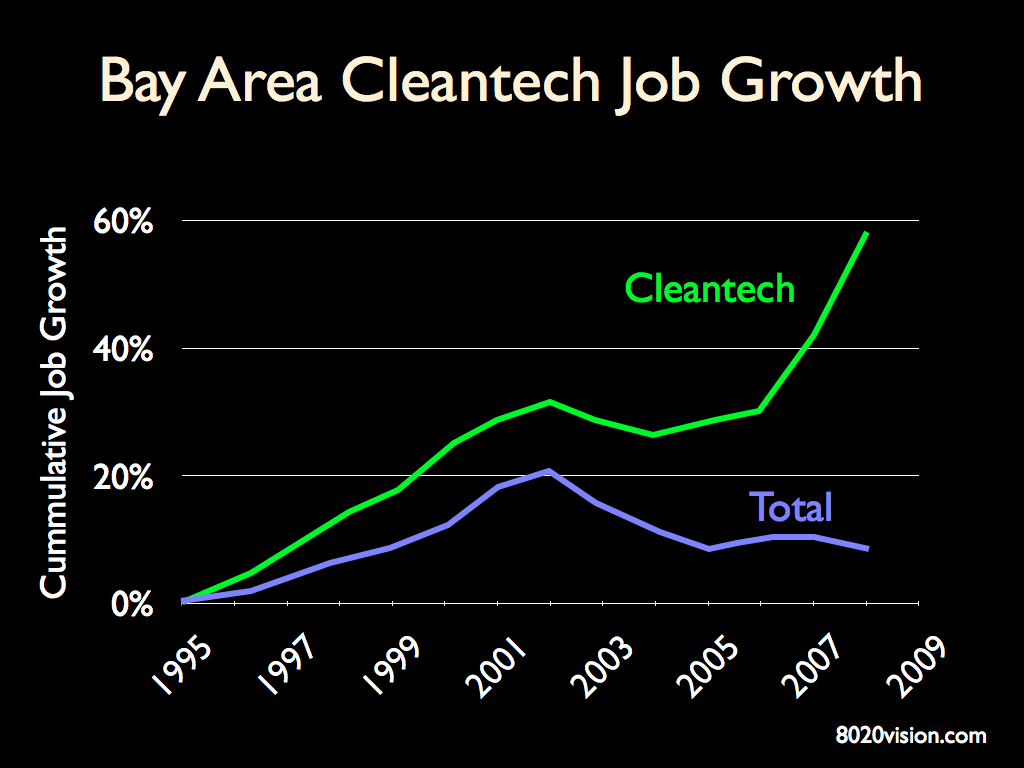
From the chart below, we can see that Cleantech jobs in the California Bay Area are on a fast growth path. Silicon Valley is becoming Cleantech Valley.

cleantech job growth in California
(source: US Bureau of Labor Statistics)

As sustainable business thinker Andrew Winston recenlty said:

“One global economy, the clean one, is growing, and the global battle for the new jobs is on. Some countries – such as China, Germany, Spain, Portugal, and many others – are going after these jobs aggressively. The other part of the economy – the dead fuel economy – is not going to be a growth engine (with the important exception of natural gas, which may provide a useful, medium-term bridge to the future).”

Clean economy jobs are growing ten times faster than the statewide average. AB32 is driving that growth as we transition to a clean energy economy.

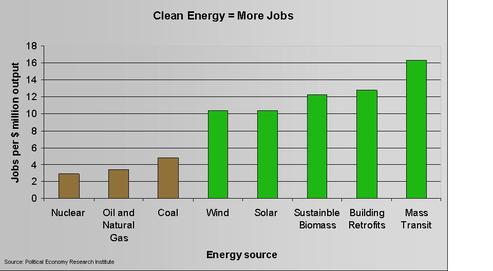
cleantech jobs
Clean energy puts more people to work, while building the cleantech economy of the future.

AB32 is largely funded by revenue from fees. As AB32 ramps up it will require the implementation and collection of significantly higher fees to fund the implementation and enforcement of the Air Resources Board’s (ARB) scoping plan to reduce greenhouse gas (GHG) emissions to 1990 levels by 2020. If Big Oil succeeds in passing Prop 26, they take the teeth out of AB32 and pass the cost of policing businesses to the tax payers. Voting NO on Prop 23 and Prop 26 keeps big business accountable when they do harm.

Prop 23 Support is Fading

California voters are catching on to the fact that Prop 23 was an initiative promoted and funded by out of state Big Oil companies.
Dan Morain at the Sacramento Bee writes:

Heading into the final two weeks before the Nov. 2 election, the main funders, Texas-based Valero and Tesoro oil companies, seem to have concluded it makes no sense to throw more of their oil-stained millions at the bad idea.
Yes-on-23 strategist Rick Claussen told me last week that there would be no final push unless backers came through with $10 million fast. The week came and went without an infusion.

Why did out of state Big Oil give up on Prop 23? 3p’s article Investors Nervous About Proposition 23 offers us a clue:

Laura Campos, Director of Shareholder Activities at the Nathan Cummings Foundation, said that shareholders are “concerned Tesoro’s support for the highly controversial Proposition 23 could lead to a decrease in shareholder value by damaging the company’s reputation and negatively impacting the business environment in a state where Tesoro has significant operations.”

As oil company manipulation of California politics has gained public exposure, shareholders are concerned that voters will vote with their feet, and not shop at gas stations of the Prop 23 proponents.

And this week, as if to help drive the final nail into the Prop 23 coffin, the White House went public with its opposition to Prop 23.

Prop 26 is a Stealth Prop 23 For Big Oil

While out of state Big Oil may be giving in on Prop 23, they are not giving up on taking the teeth out of AB32. They are shifting the fight to Prop 26, which hasn’t been in the public eye much.

If we want to understand who benefits from Prop 26, we need to follow the money. Prop 26 is funded almost exclusively by oil, tobacco and alcohol companies.

Here are the top five contributing industries pushing Prop 26:

Oil & Gas $3,734,500
Pro-Business $3,377,323
Food & Beverage $2,054,500
Alcohol Producers $1,971,843
Tobacco $1,250,000

The biggest individual contributors include:

California Chamber of Commerce $3,337,323
Chevron Corporation $2,500,000
American Beverage Association $1,950,000
Philip Morris USA Inc. * $1,250,000
Anheuser-Busch Companies, Inc. * $925,000
ConocoPhillips $525,000
Cypress Management Company, Inc. * $500,000
MillerCoors $350,000
Wine Institute * $275,593
Chartwell Partners LLC $250,000
Occidental Petroleum $250,000

Source: California Secretary of State, Campaign Finance Division and Maplight.org

KQED radio recently hosted a debate on Prop 26, between John Dunlap, a proponent of Prop. 26, and Lenny Goldberg, executive director of the California Tax Reform Association and an opponent of Prop. 26. A commenter on that debate summed it up nicely:

What Mr. Dunlap and the industries supporting Prop 26 are really trying to do is overturn a unanimous (7-0) California Supreme Court decision (the Sinclair case mentioned at the beginning of the show) that said fees can be charged to address public health, environmental or other social problems directly associated with the production or use of a product. These legitimate regulatory fees are not “hidden taxes” as the proponents suggest. What voters really have to decide is, was the Supreme Court correct in saying, essentially, the polluter pays for their pollution. The alternative is that the public pays through poorer health or through their tax dollar (either through higher taxes or shifting tax revenues away from other services like education and law enforcement).

As I mentioned above, AB32 fosters job growth as we transition to a cleantech economy. When Big Oil tries to gut AB32, they hurt the California economy. But more than that, by promoting Prop 26, they are thumbing their nose at the citizens of California and shunning their responsibility for their toxic industry. A paper by the California Alliance for Environmental Justice, “Toxic Twins”, provides examples of Tesoro and Valero – two major Big Oil proponents of Prop 23 – and their toxic corporate behavior in California.

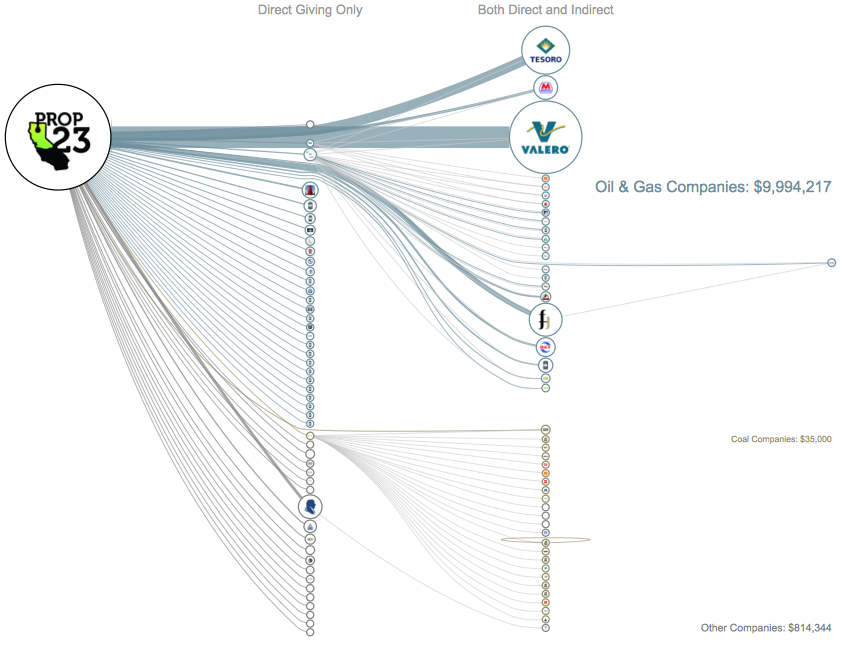
For more on out of state big oil, and a comprehensive list of backers of Prop 23, see Oil Change International’s excellent interactive map for info on who is funding Prop 23.

California Prop 23 money - big oil funding

David and Goliath

I leave you with this inspiring video of Joel Francis, a Senior at Cal State LA. Joel challenges the Goliath of Big Oil – multi-billionaire Charles Koch, of Koch Industries – to a debate. Koch is one of the major contributors to Prop 23, along with a variety of other initiatives and politicians working against a transition to a clean energy economy.

In Joel’s challenge, he says:

“Mr. Koch, I get that you and your corporation don’t want to be part of our clean energy future. That’s your free market choice. But that doesn’t mean you get to wreck its development for everyone else.”

Joel Francis Debate Challenge Prop 23
click link above to see the video

There is an age old attempt going on, of companies indirectly trying to shape the public understanding of key issues.

Let’s make sure we all do our homework.

Time just posted a good article on European Big Oil companies funding climate skeptics, that relates to all this. It’s worth reading.

And with elections across the country in their final days, if you want to see if your representatives are receiving money from big oil, check out http://dirtyenergymoney.org/.

For more on the California’s Prop 23 initiative, see:

Google: Implications of California’s Proposition 23

Prosperity Without Growth

Keywords: smart growth, sustainable growth, sustainable business, Edward D. Hess, Strategy+Business

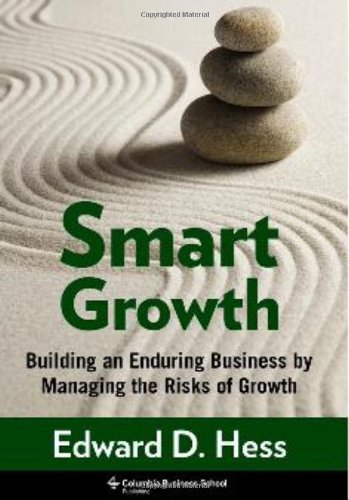
In the latest issue of Strategy and Business, David K. Hurst reviews Smart Growth by Edward D. Hess. The review is below. For more on growth and sustainability see:

Nobel Laureate Joseph Stiglitz on Sustainability and Growth

Prosperity without Growth: A review of Smart Growth by Edward D. Hess

Edward D. Hess, professor of business administration and Batten Executive-in-Residence at the University of Virginia’s Darden School of Business, has a heretical thought: Growth may not be good. In Smart Growth, he questions the four major assumptions behind the conventional wisdom of corporate success, which he calls the “growth mental model” (GMM): that businesses must grow or die, that growth is unequivocally good, that growth should be smooth and continuous, and that quarterly earnings are the primary measure of success. In addition, he supplies a series of trenchant questions for managers to ask themselves about how, why, and even whether their firms should grow.

In nine crisp chapters, Hess demonstrates that the GMM is neither possible in practice nor feasible in theory, and that attempts to meet its demands can create insurmountable obstacles to corporate sustainability. His arguments are supported by a series of case studies showing that growth is usually uneven and episodic — impossible to sustain for more than relatively short periods of time. Thus, attempts to “implement” the GMM result either in profitless growth, especially through acquisitions, or in ersatz earnings produced via a wide variety of financial manipulations. To test whether the concept of the GMM is supported by theoretical perspectives on growth, Hess turns to economics, organizational strategy and design, and biology. He finds that neoclassical economics is the framework that is most sympathetic to the GMM, but its assumptions do not hold up in the real world; that the strategic and design perspective offers little support for the GMM; and that biological theories are notable for the stress they put on the limits to growth. So there is little support for the conventional wisdom in theory.

Hess’s conclusion is that corporations should aim for sustainable or “smart” growth by asking some key questions, especially regarding the resources most needed to support such growth. Following economist Edith Penrose’s resource-based theory of the firm, he contends that the true limit to growth is usually defined by the capabilities of the firm’s managers — supporting this argument with the well-documented case of Starbucks’s overreach, in which the rapid expansion in the number of stores caused liabilities to rise precipitously and diluted the value of the brand.

All this makes good sense. The only shortcoming may be the author’s failure to examine why the GMM is so robust in the face of all the evidence against it. Is it because there are large constituencies in the economy that generate revenue by pushing the GMM and thriving on the turmoil it creates? If so, is there a need for public policy addressing it? And what risks do firms run if they eschew the flawed GMM in favor of smart growth?

Author Profile:

David K. Hurst is a contributing editor of strategy+business. His writing has also appeared in the Harvard Business Review, the Financial Times, and other leading business publications. Hurst is the author of Crisis & Renewal: Meeting the Challenge of Organizational Change (Harvard Business School Press, 2002).

Reprinted with permission from the strategy+business website. Copyright 2010 by Booz & Company. All rights reserved. www.strategy-business.com

More on Smart Growth at Amazon.com

China Manufacturing and Transport Cost Showing Sharp Rise – Trends and Implications for Business

Keywords: China, manufacturing cost, transport cost, Credit Suisse, jobs, per capita income

There is growing concern among U.S. and European companies that higher China manufacturing and transport cost, coupled with an inability to push through price increases due to the weak economy, will pressure profit margins in 2011. This according to a Credit Suisse report citing their survey of mostly private consumer, industrial and technology companies that source products from China. An article in Reuters provides details – highlights below.

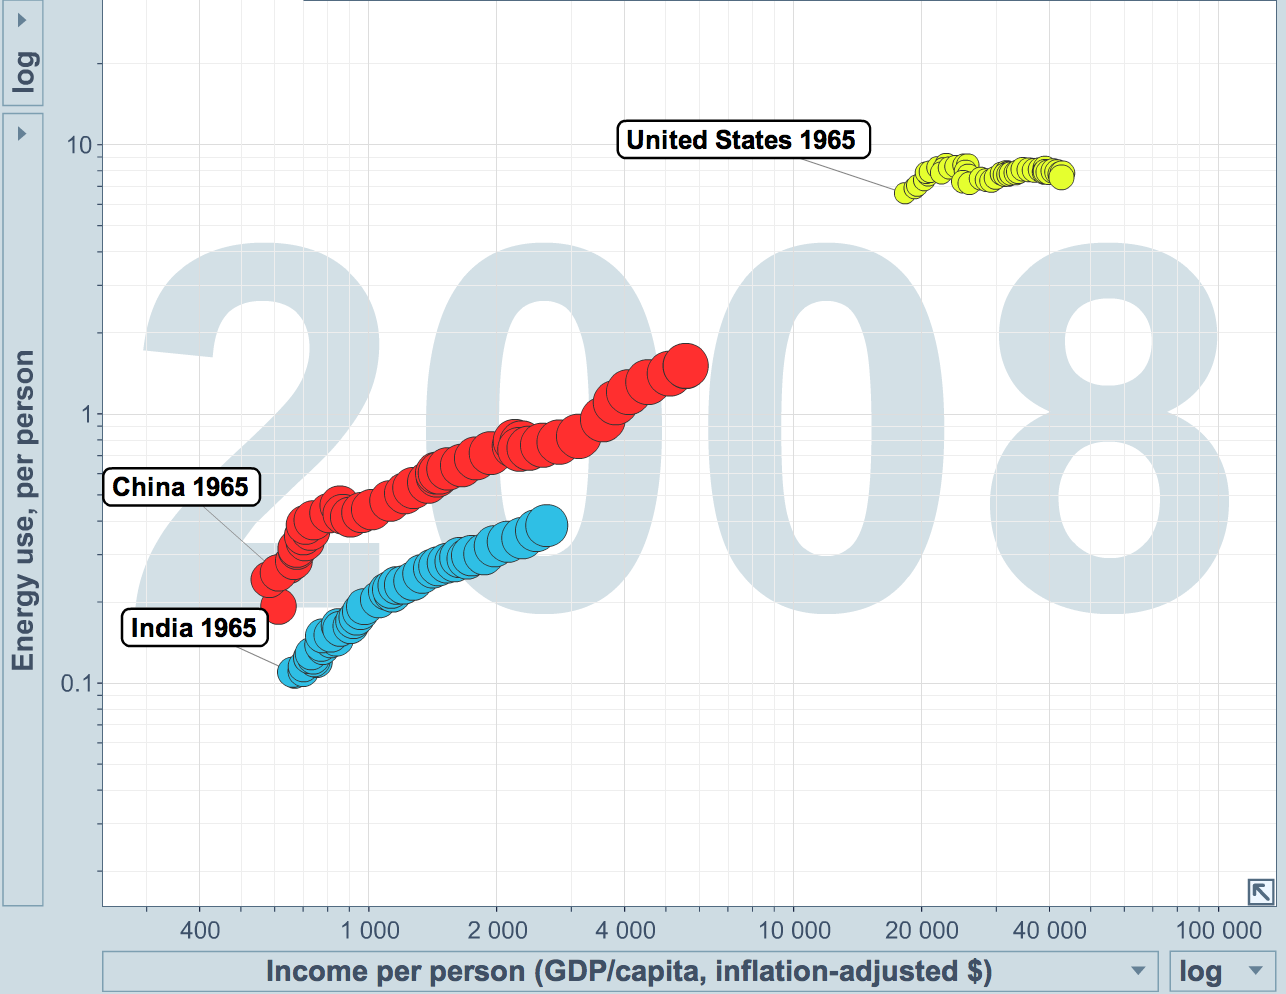
This should not come as a surprise to anyone that is observing the trends in China around per capita income and consumption. China is becoming America – fast. Before we know it, we will be bringing jobs back here to the US. You might think that jobs would migrate to India or Southeast Asia next, and there will be some of that, but the inflation occurring in China will happen to those countries too as they move up the income and consumption curve. Using GapMinder’s Trendalyzer with energy consumption data from BP’s Statistical Review of World Energy 2010 and income data from the IMF, we can see some powerful trends unfolding (N.B. data presented for 1965 through 2008, 1 year steps, circle area proportional to population size, energy use in tonnes of oil equivalent):

Energy Consumption and Income for US, China, and India
Per Capita Income and Energy Consumption in China, India and the US

And with increasing resource scarcity (water, energy, food) and climate change, those regions will likely be challenged by social tensions or state instability (see National Intelligence Assessment on the National Security Implications of Global Climate Change to 2030 by US Director of National Intelligence in Recommended Reading). With all this to consider, we encourage companies to take the long view as they evolve their manufacturing strategy.

Highlights from China costs may surprise investors–Credit Suisse

  • Credit Suisse, which said it sees the risk of very limited pricing power for consumer companies next year amid tepid economic growth, found 40 percent of respondents are “very worried” or “extremely worried” about wage pressure in China; 29 percent are very or extremely worried about transport costs; and 18 percent are so about the rising yuan currency.
  • About 40 percent of executives said their costs on Chinese-sourced goods are up at least 6 percent from a year ago, with nearly a third reporting a double-digit increase. The survey polled 28 firms with annual sales of at least $500 million that rely on China for a portion of their goods sold.
  • Nearly half of respondents said it is “not easy at all” to relocate sourcing from China and two-thirds say they could increase prices somewhat, but would likely lose profit margin.
  • China’s explosive economic growth has pushed up manufacturing wages nearly fourfold over the past decade. The average worker earns about $3,900 a year, up from about $1,900 in 2005 and just over $1,000 a year in 2000. Wages are expected to rise further, reflecting emerging labor shortages.
  • The pace of wage increases, currently around 13 percent a year, could accelerate, Rochon said. With U.S. wages flat or down, the difference in costs is narrowing, especially as transport costs — and times — go up.
  • Containership fleets, eager to cut capacity, save fuel and raise prices, have slowed ships crossing the Pacific by about 50 percent. More inventory is sitting on the ocean.
  • Factoring in currency, wages and transport, the hit to earnings could be substantial for some companies, Rochon said.
  • Credit Suisse posits a worst-case scenario in which costs rise 20 percent with no ability to pass on higher prices. Under that scenario, 2011 earnings per share (EPS) would be reduced by about 60 percent at Maidenform Brands Inc and by some 70 percent at Jones Apparel Group Inc.
  • Giant retailers like Target Corp and Macy’s Inc would see about a 40-percent hit to 2011 earnings. On the other hand, a stronger currency and rising living standards in China could benefit companies that sell to Chinese consumers, such as Yum Brands Inc and McDonald’s Corp, the report said.
  • The biggest risks are not to makers of high-margin, easy-to-ship products like Apple Inc’s iPads, or to labor-intensive, high-volume manufacturers like clothing companies, which can move operations. Rather it is companies in the middle that are the most exposed, such as low-priced retailer Dollar Tree Inc with about 40 percent of goods sourced from China, according to Credit Suisse.
  • Current Wall Street estimates call for Dollar Tree to earn $3.35 per share in fiscal 2011, according to Thomson Reuters I/B/E/S. That would fall to $2.24 if costs rose 20 percent with some pricing power, and EPS would be only $1.67 without pricing power, the report estimates.
  • Some companies have already responded. General Electric Co, for example, has moved production of its hot water heaters to Kentucky from China, partly as a reaction to cost.
  • Large industrial companies like GE, Cummins Inc and Emerson Electric Co would see 2011 EPS reduced by 10 percent or more under the adverse scenario.
  • Electrical machinery and equipment were the top U.S. imports from China at $73 billion, though the report notes many industrial companies manufacture in China for the local market and are able to move production elsewhere.