Which Energy Industries Would You Subsidize?

Subsidies and tax breaks are a tried and true way of helping a developing industry get up on its feet.

One of the strategies to accelerate a transition to cleaner greener renewable energy sources is to subsidize research development, and production of renewable energy sources, such as wind power, solar power, geothermal, etc.

Free market advocates often say that the emerging renewable energy industry should not be subsidized. What is not widely know though, is that subsidies for well established fossil fuels exceed renewables by almost six to one.

Research by the Woodrow Wilson International Center for Scholars and the Environmental Law Institute reveals that the lion’s share of energy subsidies supported energy sources that emit high levels of greenhouse gases (GHGs). The study, which reviewed fossil fuel and energy subsidies for Fiscal Years 2002-2008, showed that the federal government spent about $70 billion on the fossil fuel industry, and about $12 billion on renewables. As the report points out:

Moreover, just a handful of tax breaks make up the largest portion of subsidies for fossil fuels, with the most significant of these, the Foreign Tax Credit, supporting the overseas production of oil. More than half of the subsidies for renewables are attributable to corn-based ethanol, the use of which, while decreasing American reliance on foreign oil, has generated concern about climate effects.These figures raise the question of whether scarce government funds might be better allocated to move the United States towards a low-carbon economy.
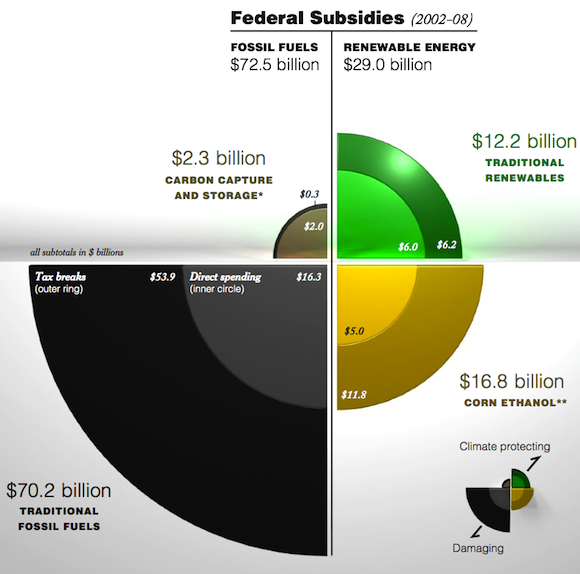
energy subsidies fossil fuel, oil, coal, wind, solar, ethanol
Source: Internal Revenue Service, U.S. Department of Energy (Energy Information Administration), Congressional Joint Committee on Taxation, Office of Management and Budget, & U.S. Department of Agriculture

N.B. Carbon capture and storage is a developing technology that would allow coal-burning utilities to capture and store their carbon dioxide emissions. Although this technology does not make coal a renewable fuel, if successful it would reduce greenhouse gas emissions compared to coal plants that do not use this technology. The production and use of corn ethanol can generate significant greenhouse gas emissions. Recognizing that the production and use of corn-based ethanol may generate significant greenhouse gas emissions, the data depict renewable subsidies both with and without ethanol subsidies.

Fossil fuel extraction is increasingly toxic (e.g. fracking poisons public water systems) and environmentally destructive (e.g. gulf oil “spill”). And fossil fuel production seems to be hitting a Peak Oil wall. As production lags demand, we should expect oil and gas prices to rise precipitously. Subsidizing oil keeps us addicted to it.

Three of the top 5 biggest companies in the world are oil companies (Exxon, BP, Royal Dutch Shell). Rather than subsidize Big Oil profits and foreign oil nations, we should be taxing fossil fuels to reduce their use.  Tax what we want to reduce, and subsidize what we want to increase. Tax what harms us, and subsidize what helps us. Use the taxes to fund R&D and development of a world class alternative energy industry.

Obviously, that means politicians will need to resist the monied special interests of the Big Oil lobby.

What would you like to see your politicians do?

[polldaddy poll=”4447501″]

Recommended Reading

Top Business Leaders Deliver Clean Energy Plan by Jay Kimball
Examining the Relationship Between Growth and Prosperity

Most cities in the U.S. have operated on the assumption that growth is inherently beneficial and that more and faster growth will benefit local residents economically. Local growth is often cited as the cure for urban ailments, especially the need for local jobs. But does the empirical evidence show that growth is actually providing these benefits?

To test claims about the benefits of local growth, I examined the relationship between growth and prosperity in US metro areas. This study looked at the 100 largest US metro areas (representing 66% of the total US population) using the latest federal data for the 2000-09 period. The average annual population growth rate of each metro area was compared with unemployment rate, per capita income, and poverty rate using graphical and statistical analysis.

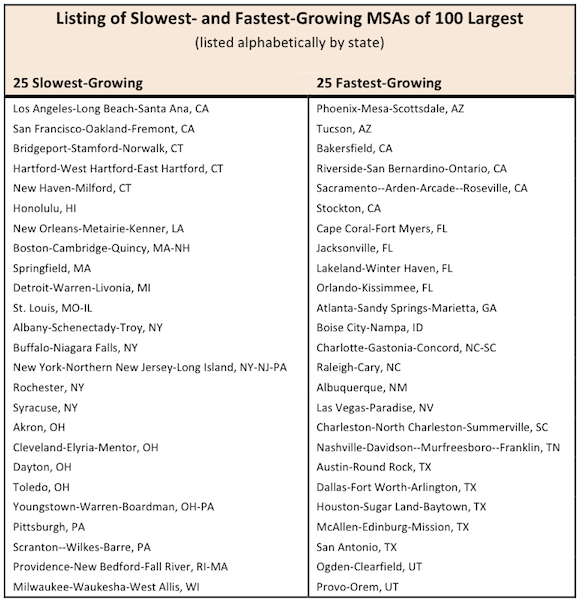
Listing of Slowest and Fastest Growing MSAs of 100 Largest

The “conventional wisdom” that growth generates economic and employment benefits was not supported by these data. The study found that those metro areas that have fared the best had the lowest growth rates. Even metro areas with stable or declining populations tended to fare better than fast-growing areas in terms of basic measures of economic well-being.

Some of the remarkable findings:

  • Faster-growing areas did not have lower unemployment rates.
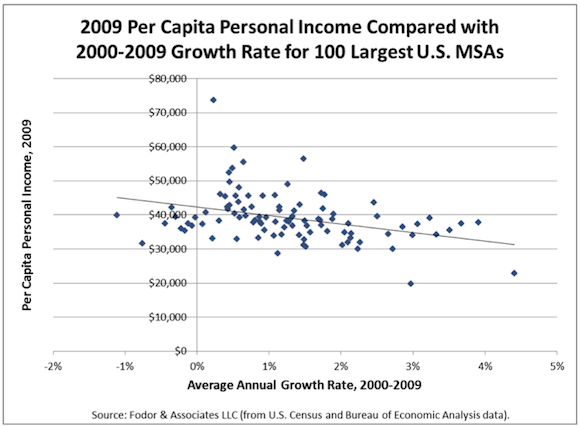
  • Faster-growing areas tended to have lower per capita income than slower-growing areas. Per capita income in 2009 tended to decline almost $2,500 for each 1% increase in growth rate.
  • Residents of faster-growing areas had greater income declines during the recession.
  • Faster-growing areas tended to have higher poverty rates.

The 25 slowest-growing and 25 fastest-growing areas were compared. The 25 slowest-growing metro areas outperformed the 25 fastest-growing in every category and averaged $8,455 more in per capita personal income in 2009. They also had lower unemployment and poverty rates.

Comparison of 25 Fastest and 25 Slowest Growing Metro Areas of 100 Largest for the 2000 - 2009 Period

Another remarkable finding is that stable metro areas (those with little or no growth) did relatively well. Statistically-speaking, residents of an area with no growth over the 9-year period tended to have 43% more income gain than an area growing at 3%/year. Undoubtedly this offers a ray of hope that stable, sustainable communities may be perfectly viable — even prosperous — within our current economic system.

Per Capita Income versus Growth Rate Chart top 100 MSAs

While certain businesses prosper from growth, apparently the balance of the community does not. The statistics showing that fast-growing areas tend to have lower and declining incomes, indicate that any gains by the businesses that directly benefit from growth are more than offset by losses to the rest of the local population. In other words, a small segment of the local population may benefit from faster growth, but the larger population tends to see their prosperity decline.

This study was not an attempt to explain all the complex relationships that exist, but merely to test whether there is a correlation between growth and some of the benefits that are so often attributed to it. More research is clearly needed on this important topic.

Population growth tends to be directly linked to urban growth. There is a close, linear relationship between the two, as more people require more housing units and more commercial buildings for employment and shopping.

Public policies and plans regarding urban growth typically involve tradeoffs between economic, environmental, and social impacts. Local residents may view a policy to encourage land development or growth as negatively impacting their quality of life through increased traffic congestion, environmental quality impacts, loss of farm and forest lands, and loss of amenity values (such as tranquility, sense of community, and open space). They may also be concerned about higher taxes to fund the cost of the new public infrastructure (roads, schools, sewer and water systems, etc.) required to serve growth. However, the prospect that new growth will bring jobs and economic prosperity that may benefit local residents is often viewed as compelling enough to outweigh these costs.

So if growth is actually not providing these benefits, then the decision-making balance shifts towards the fiscal, environmental, and quality-of-life impacts. With greater awareness of the relationship between growth and prosperity, perhaps we will see a shift in our focus toward making our cities better places, not just bigger places.

Most US cities have been actively pursuing growth with all the policy and financial tools at their disposal under the presumption that they are fostering local prosperity. As US cities seek a path out of the recession, this study suggests that new economic development strategies will be needed that do not rely so heavily on growth. ###

To read the full study, see: Relationship between Growth and Prosperity in 100 Largest U.S. Metropolitan Areas by Eben Fodor

Eben Fodor is the Principal of Fodor & Associates, a consulting firm based in Eugene, Oregon specializing in studying the fiscal, economic, and environmental impacts of urban growth and land development. This independent research was funded by Fodor & Associates as a public service.

Recommended Reading

Nobel Laureate Joseph Stiglitz on Sustainability and Growth by Jay Kimball

What’s Causing the Long Lines at Gas Stations in China?

Long lines are forming at gas stations in China. Truck drivers now wait in line for hours to fill up on diesel fuel. What’s going on? The answer is not what you might think.

No, it’s not peak oil (at least not yet). And unlike the oil embargo of the seventies, where the middle east slowed down the flow of oil to industrial nations, China is able to purchase most the oil it needs (for now). No, in this case, the fuel shortages are self-inflicted.

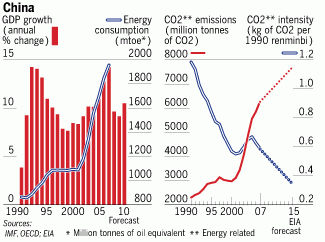
china energy intensityChina is, by some measures, the largest consumer of energy in the world and they are trying to reduce their consumption.

It takes a lot of energy to grow a modernizing society. To meet energy demand, China has been building power plants every week or two, many of them greenhouse gas emitting coal-fired plants. The damage to their environment, public health, and contribution to global pollution, CO2 emissions, and climate change are enormous. Reducing energy consumption will help slow and eventually lessen toxic impact.

Chinese leaders want to reduce their energy intensity, or the energy use per unit of GDP. Their goal is to reduce energy intensity by 20 percent from where it was five years ago.

To achieve this goal, China has implemented Draconian measures, including:

  • planned power outages
  • shutting down more than 2,000 outdated factories in heavy industry
  • turning off traffic lights in some areas
China save energy cartoon
A black-sleeved arm marked "Energy Target" presses down on little official yelling "I have to apply the brakes and save energy!" (source: Xinhua News Agency)

Small and medium business, unable to get special exceptions from party officials, are hardest hit by the power cutbacks. In frustrated response, entrepreneurial business owners are adapting by buying generators to make their own power. An unintended consequence: Generator prices are soaring, and factory owners have been stocking up on diesel fuel to power the generators, increasing demand for diesel fuel.

To make matters worse, according to the Financial Time

Wholesalers, betting on future price hikes, started storing diesel instead of selling it. Meanwhile diesel’s wholesale price, which is less tightly controlled by the state, started to soar and soon exceeded the retail price—so many gas stations could only sell diesel at a loss. There is also a basic shortage of supply: China’s diesel imports have soared and the country has announced a ban on diesel exports next year, according to reports.

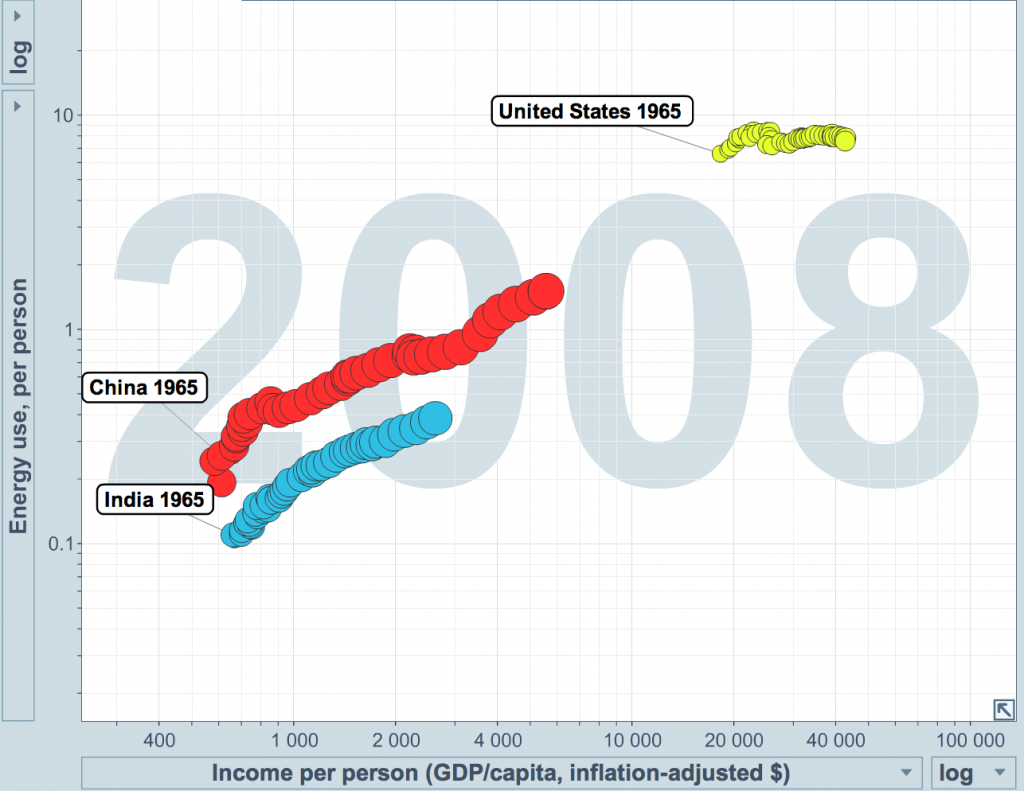
China is walking a fine line between trying to restrain growth, and giving freedom the their citizens, who long for western super-consumer lifestyles. As China per capita income has soared, so has per capita energy consumption. The chart below shows income and energy use from 1968 through 2008, for the US, China, and India.

Energy Consumption and Income for US, China, and India
Per Capita Income and Energy Consumption in China, India and the US (source: BP’s Statistical Review of World Energy 2010, IMF)

While the gas lines are largely due to China’s brute force energy policy aimed at efficiency, as the world recovers from the global recession, heavy energy users like the US, China and India will likely return to their pre-recession energy consumption levels, and we should expect to see higher fuel prices.

And as we enter firmly into the peak oil phase of oil production, shifting to renewable forms of energy will be more important than ever.

Recommended Reading

The Real Population Problem by Jay Kimball

China: The Next Superconsumer? by Jay Kimball

Beijing Power Consumption Hits Historic Peak During Extreme Heat Wave by Jay Kimball

German Military Study Warns of Potential Energy Crisis by Jay Kimball

California’s Other Storm of the Century

The extreme rain pummeling Southern California mirrors extreme weather incidents around the globe. Should the heavy rain in California persist, as the soil becomes saturated, mudslides and flooding follow.

The video below shows an example of the results of extreme rain. A mudslide in Maierato, Calabria, Italy results as the soil becomes saturated with rain. Liquefaction of the land occurs – the earth, rock and soil flow like a river, carrying trees, homes, anything on the surface down hill. The video is visually astonishing.

storm related damage from extreme weather, extreme rainAs climate change progresses, weather extremes increase. New records are increasingly set for heat, cold, drought, and rain. Climate models predict an increase in the frequency and severity of extreme rainfall events.

Sh!t Rolls Downhill

Insurance companies were some of the early businesses embracing climate change models and planning for how to mitigate losses. Weather related losses are growing exponentially. Just as with earthquake insurance, as insurance companies limit their exposure to losses due to climate change and extreme weather, property owners will be forced to make choices on whether to pay higher insurance premiums or go uninsured. Faced with extremely expensive premiums, only about 12% of California property owners choose to pay for earthquake insurance. When an extreme event happens, the property owner often ends up with the loss.

In California, Climate Change is especially pernicious. During summer, persistent warming and drought lead to wildfires and denude the land, then, during the winter months, extreme rain sets the stage for disastrous mudslides and flooding.

Coincidentally, the US Geological Survey (USGS) just announced that they are about to release an emergency preparedness plan for extreme storms:

The USGS Multi Hazards Demonstration Project (MHDP) is preparing to release a new emergency-preparedness scenario, called ARkStorm, to address massive U.S. West Coast storms analogous to those that devastated California in 1861–62. Storms of this magnitude are projected to become more frequent and intense as a result of climate change.

The MHDP has assembled experts from the National Oceanic and Atmospheric Administration (NOAA), USGS, Scripps Institute of Oceanography, the State of California, California Geological Survey, the University of Colorado, Federal Emergency Management Agency (FEMA), the National Center for Atmospheric Research (NCAR), California Department of Water Resources, California Emergency Management Agency (CalEMA) and other organizations to design the large, but scientifically plausible, hypothetical storm scenario that would provide emergency responders, resource managers, and the public a realistic assessment of what is historically possible.

California’s Storm of the Century

Beginning on Christmas Eve, 1861, and continuing into early 1862, an extreme series of storms lasting 45 days struck California. The storms caused severe flooding, turning the Sacramento Valley into an inland sea, forcing the State Capital to be moved from Sacramento to San Francisco for a time, and requiring Governor Leland Stanford to take a rowboat to his inauguration.

William Brewer, author of “Up and down California,” wrote on January 19, 1862, “The great central valley of the state is under water—the Sacramento and San Joaquin valleys—a region 250 to 300 miles long and an average of at least twenty miles wide, or probably three to three and a half millions of acres!”

In southern California lakes were formed in the Mojave Desert and the Los Angeles Basin. The Santa Ana River tripled its highest-ever estimated discharge, cutting arroyos into the southern California landscape and obliterating the ironically named Agua Mansa (Smooth Water), then the largest community between New Mexico and Los Angeles. The storms wiped out nearly a third of the taxable land in California, leaving the State bankrupt.

Here’s a drawing of Sacramento in 1862, after the storm.

California storm of 1861

For more on Climate Change and weather, see:

Atlantic Hotter Than Before Katrina, Boosting Storm Forecasts

State of the Climate: Hottest Decade on Record

Jeremy Grantham: Everything You Need to Know About Global Warming in 5 Minutes

How Charles David Keeling Woke the World up to Climate Change

charles david keeling
Charles David Keeling

My wife just emailed me this great story. A compelling retrospective of Charles David Keeling, the scientist who measured the steadily increasing level of carbon dioxide (CO2) in the atmosphere, transforming the scientific understanding of humanity’s relationship with the earth.

The article, A Scientist, His Work and a Climate Reckoning, written by Justin Gillis, appeared in The NY Times today. It is an excellent even-handed overview and backstory of climate change.

As Congress dithers with political inaction on climate change and investment in renewable energy, this article provides a window into the quiet work of scientists around the world who say something extraordinary is going on.

I hope you will take 5 minutes and read every word. This is our history and our future.

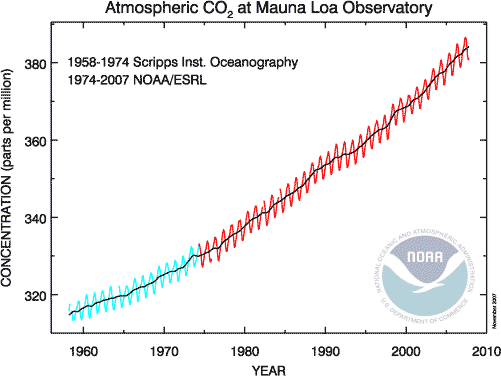
Keeling died in 2005, but his son Ralph continues in his footsteps. Here’s a picture of the Keeling Curve – the history of atmospheric CO2 – measured by Keeling, starting back in 1958.

keeling curve
The Keeling Curve

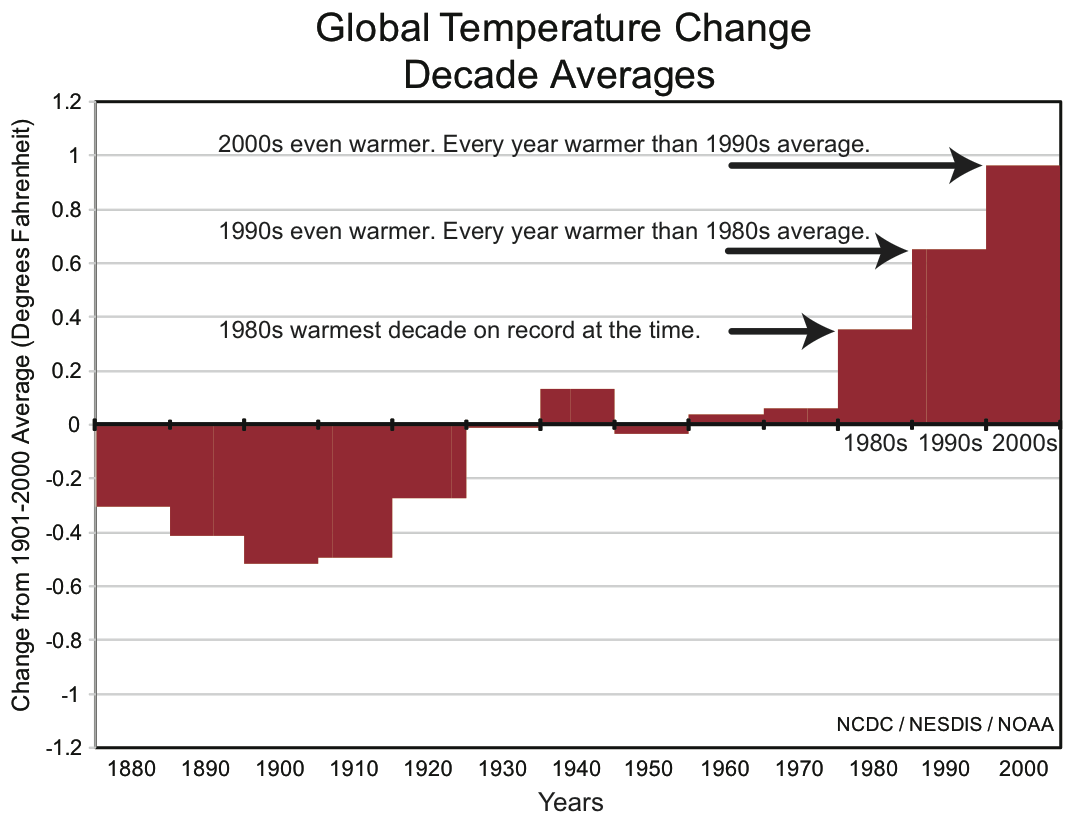
As atmospheric CO2 has increased, so has global temperature.
Global Temperature Change Decades

And with rising temperatures, we are seeing increases in extreme weather events.

For more on Climate Change, click on the Climate Change topic in the sidebar to the right.

For more on Charles David Keeling, see his biography at Scripps Institution of Oceanography.

While Congress Dithers, U.S. Military Speeds Transition to Alternative Energy

The most read article at the NY Times online yesterday was The U.S.S. Prius by Thomas Friedman. The thrust of the article centers around two brutal facts – we are fighting wars for oil, and wars consume a lot of oil. One of the tidbits mentioned toward the end of the article is that a gallon of gas costs up to $400 per gallon by the time it reaches the front lines. Moving beyond the economics, getting fuel to the front lines also costs lives. The U.S. military loses one soldier for every 24 fuel convoys it runs in Afghanistan.

Friedman observes “at a time when a fraudulent, anti-science campaign funded largely by Big Oil and Big Coal has blocked Congress from passing any clean energy/climate bill” the U.S. Navy and Marines are spearheading a strategy to make the military much more energy efficient. Friedman adds, “Unlike the Congress, which can be bought off by Big Oil and Big Coal, it is not so easy to tell the Marines that they can’t buy the solar power that could save lives.

Ray Mabus, the Secretary of the Navy, has crafted a strategy to shift from oil to alternative energy, including, solar and biofuels. On Earth Day this year, the Navy flew a F/A-18 Super Hornet fighter jet powered by a 50-50 blend of conventional jet fuel and camelina aviation biofuel made from pressed mustard seeds.

And while congress favors boondogles like corn ethanol, which uses almost as much energy producing it as it yields:

The Navy will use only “third generation” biofuels. That means no ethanol made from corn because it doesn’t have enough energy density. The Navy is only testing fuels like camelina and algae that do not compete with food, that have a total end-to-end carbon footprint cleaner than fossil fuels and that can be grown in ways that will ultimately be cheaper than fossil fuels.

Mabus has also set a goal for the Navy to use alternative energy sources to provide 50 percent of the energy for all its war-fighting ships, planes, vehicles and shore installations by 2020.

About 60% of the oil we consume is imported from foreign nations – many of those nations are petro-dictatorships. As we shift to alternative fuels and energy, we can reduce our dependance on foreign oil.

camelina oil bio-fuel
Camelina Sativa

Though many people are familiar with solar energy, innovations in the field of biofuels are less well known. Most vehicles run on liquid fossil fuels – gasoline and diesel. Biofuels, such as camelina, provide a cleaner greener alternative to fossil fuels. Camelina Sativa is a member of the mustard family, a distant relative to canola. Camelina can grow on land unsuitable for most food crops, especially arid lands. It has yields that are roughly double that of soy. Camelina can be grown in a rotation with wheat crops. Farmers who have followed a wheat-fallow pattern can switch to a wheat-camelina-wheat pattern, and produce up to 100 gallons of camelina oil per acre, while growing up to 15 percent more wheat. And once the oil is pressed from the seed, the leftover “mash” can be used as nutritious livestock feed.

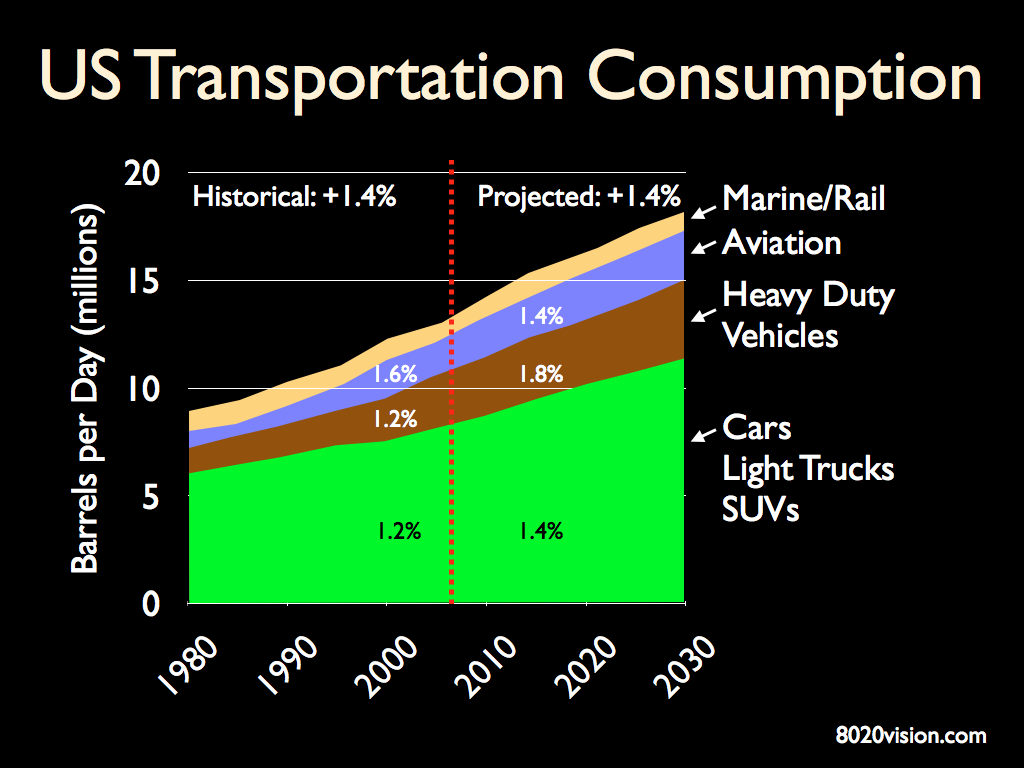
We consume more oil for transportation than anything else. Innovations in transportation fuels will have the most impact on global energy consumption and associated emissions of climate-changing CO2.

US Oil Consumption Transportation
(source:DOE)

Oil production is peaking and will become increasingly expensive. It’s time to support our transition to a cleaner, greener alternative energy.

Peak Oil

The U.S. spends more money on potato chips than energy research and development. To restore US scientific and technical leadership, Congress needs to stop bashing science and taking money from Big Oil, and start investing in our energy future.

Recommended Reading

GOP Rep. Bob Inglis On Climate Change by Jay Kimball

Camelina Oil by Sustainable Oils

Top Business Leaders Deliver Clean Energy Plan by Jay Kimball

German Military Study Warns of Potential Energy Crisis by Jay Kimball

Department of Defense Perspectives on Climate Change and Peak Oil