State of the Climate: Hottest Decade on Record

The National Oceanic and Atmospheric Administration (NOAA) just released their annual State of the Climate report.

A comprehensive review of key climate indicators confirms the world is warming and the past decade was the warmest on record. More than 300 scientists from 48 countries analyzed data on 37 climate indicators, including sea ice, glaciers and air temperatures. A more detailed review of 10 of these indicators, selected because they are clearly and directly related to surface temperatures, all tell the same story: global warming is undeniable.

The findings do not include data from 2010, which is on pace to exceed the highest annual average global temperature ever recorded, NOAA said. This summer’s weather has been defined by extreme heat events in the eastern United States, Europe, Russia, China, Japan and the Middle East.

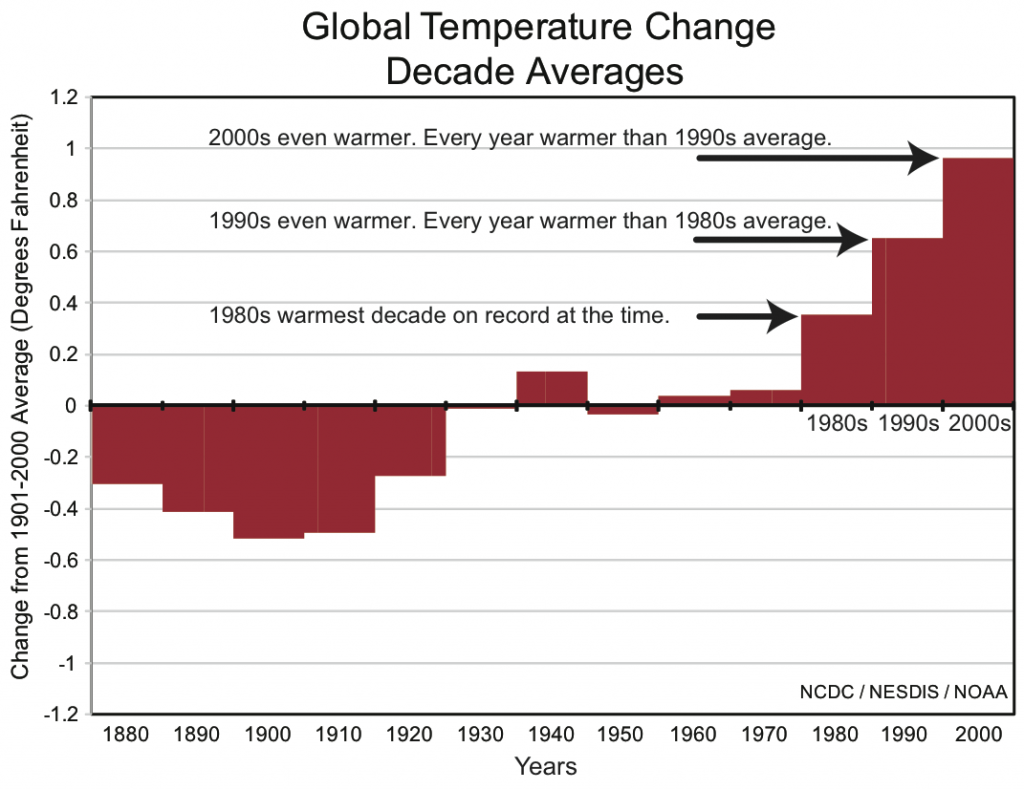
According to the report, each decade since the 1980s has been progressively warmer than the last, with an average warming of about one-fifth of a degree Fahrenheit per decade.

Global Temperature Change Decades

“The temperature increase of one degree Fahrenheit over the past 50 years may seem small, but it has already altered our planet,” said Deke Arndt, co-editor of the report and chief of the Climate Monitoring Branch of NOAA’s National Climatic Data Center. “Glaciers and sea ice are melting, heavy rainfall is intensifying and heat waves are more common.”

The pace of climate change is quickening. If this was your temperature, you would go to a doctor. If this was your car radiator temperature, you would pull over.

The challenge here is that these changes are not happening in minutes or hours, so they lack the emergency quality that galvanizes us into action. And yet, the impact to our water, food production, health, property, and quality of life will be enormous.

In Clayton Christensen’s book, The Innovator’s Dilemma, he talks about disruptive technology that changes ‘business as usual’. Some businesses fall, and some rise, depending how they respond to the disruption.

Think of this as the ultimate disruptor. How is your organization thinking about climate change? What metrics do you use to understand and track the trends? How will you minimize the impact and risk? What opportunities are their for innovation?

For more on impact, read Water Scarcity in the US, Sustainable Energy Security: Strategic Risks and Opportunities for Business, and Climate Change May Reduce Protein in Crops.

Beijing Power Consumption Hits Historic Peak During Extreme Heat Wave

China Daily is reporting the extreme heat and humidity in Beijing has lead to record consumption of electricity.  Beijing’s power consumption exceeded 15 million kilowatts for the first time in history on July 23, around 5 million kilowatts of which was consumed by air-conditioners, according to a report from the Mirror Evening News.

The picture below, with the iconic Gucci shirt, provides ironic symbolism for the superconsumer trends unfolding in China.

Beijing Heat Wave
(source: China Daily)

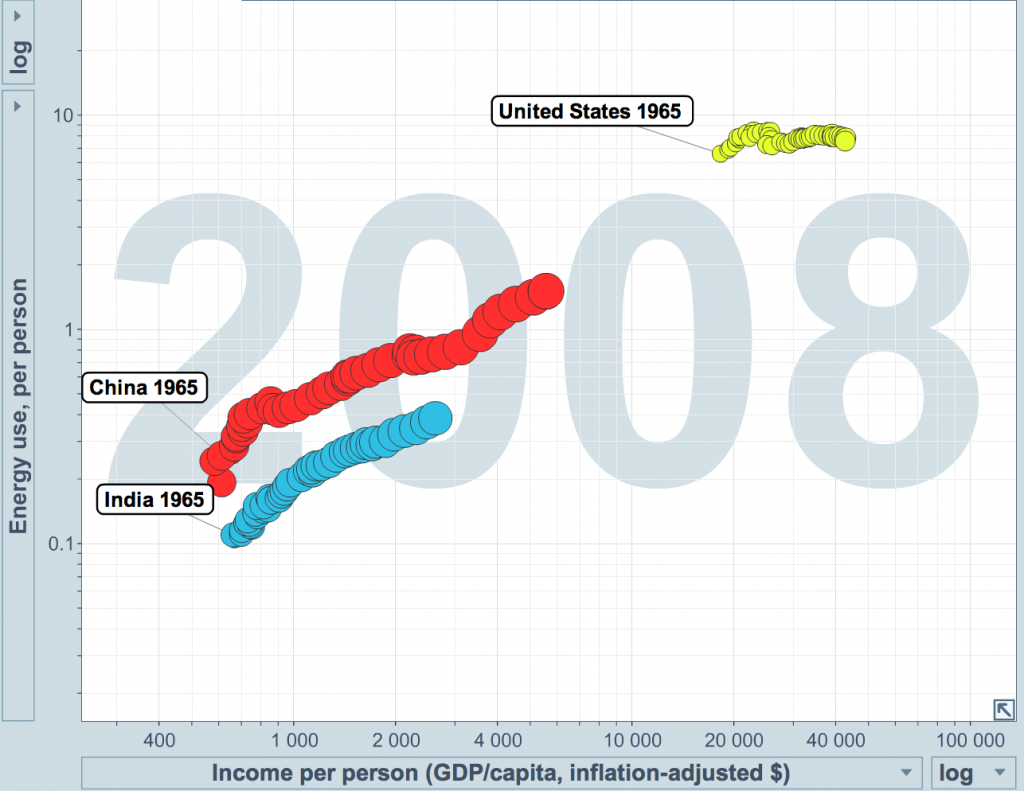
As China’s population has grown, per capita income and consumption have grown. Let’s take a look at the trends in energy use and per capita income relative to US and India. Using GapMinder’s Trendalyzer with energy consumption data from BP’s Statistical Review of World Energy 2010 and income data from the IMF, we can see some powerful trends unfolding (N.B.: Data presented for 1965 through 2008, 1 year steps, circle area proportional to population size, energy use in tonnes of oil equivalent):

Energy Consumption and Income for US, China, and India
Per Capita Income and Energy Consumption in China, India and the US
  • China and India show steadily increasing per capita income, with China having the biggest change – outperforming India more than 2 to 1.
  • This increase in income is fueling the growth of China’s middle class. Western-style patterns of consumption are leading to China’s increased consumption of energy, water, raw materials… The trend is strong and steady, with no signs of slowing.

To meet this growing need for energy, China has been building about 2 power plants per week – mostly coal burning. As is widely known, coal power generation is about as dirty as it gets, and accounts for about 20 percent of Greenhouse Gas (GHG) emissions globally. Coal is used to produce about 70% of energy consumed in China.

The Chinese are in a climate change death spiral. Using the heat wave in Beijing as an example – to meet the expanding populations growing demand for energy, China builds about 2 coal-fired power plants per week. The coal exacerbates global warming. The population turns up their air conditioners, which leads to record energy consumption and drives the need for more power plants, and the spiral continues until… What?

For more on record heat and the impact it has on people, food production and wellbeing, see NOAA: June, April to June, and Year-to-Date Global Temperatures are Warmest on Record.

Interactive Climate Map from Google Shows Future Impact of Climate Change

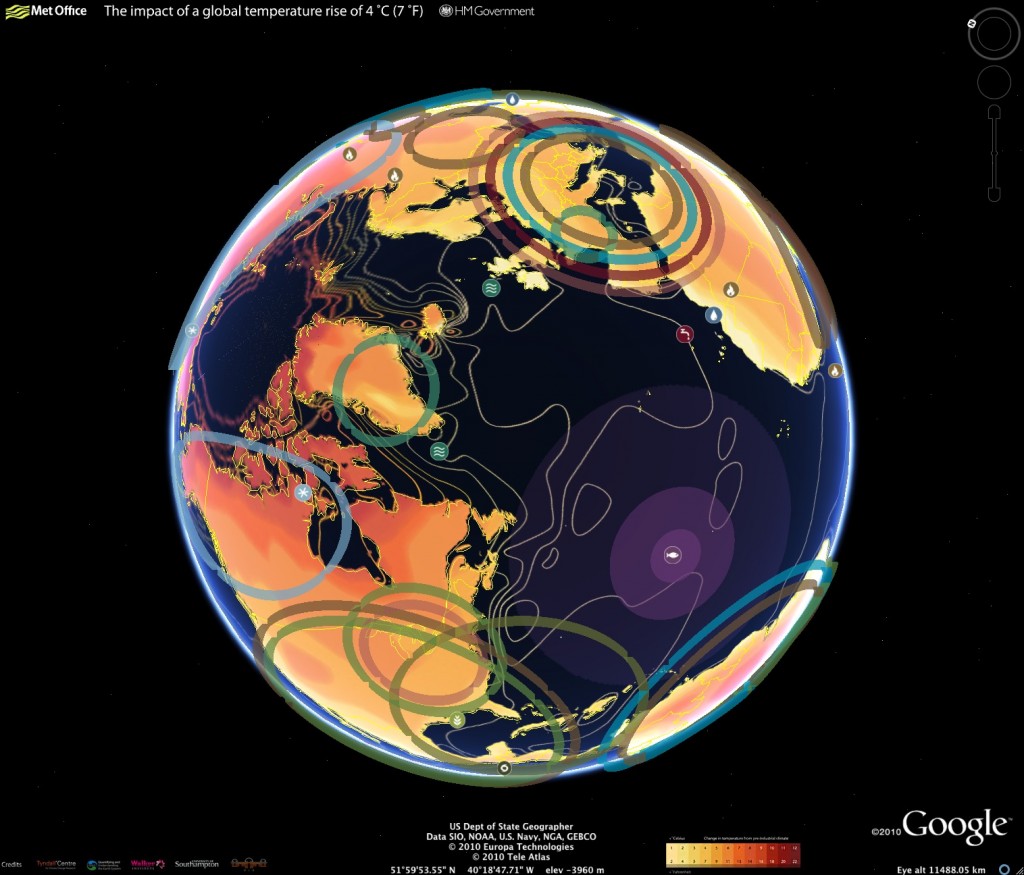
Using Google Earth, the UK Foreign Office (FCO) and the Department of Energy and Climate Change (DECC) have released an interactive climate map that provides insight on the impact of climate change around the world.

The Google Earth map shows how the world would be affected by a global average temperature increase of 4C. It illustrates rising water levels and reduced crop yields in different parts of the world if temperatures are not curbed by cutting greenhouse gases.

The map service is directed at a global audience; it details the work of the scientists working in countries across Asia, Latin America and Africa. It uses Met Office data, and will also feature Foreign Office’s own work on the economics of climate change that it has been doing with the likes of the Asian Development Bank. The map is interactive, allowing you to roam the planet and explore projected impact and view video providing climate scientists and researchers discussing impact details.

Articles detailing the project can be found at The Telegraph and the Financial TImes.  The online map is available here. If you don’t have Google Earth installed, you can download a copy here.
Climate Change Impact

Consumer Behavior: Deleveraging

Roger Lowenstein, an outside director of the Sequoia Fund, and author of The End of Wall Street has an article in The New York Times called Paralyzed by Debt.

Highlights of the article are below. It is an excellent example of the impact uncertainty and consumer unease can have on consumer behavior. To put the article in context, here are a couple charts I use when talking about consumer behavior and impact on business and government economic models.

Maslow's Hierarchy of Needs

In Maslow’s hierarchy, the higher level needs can only be met when the foundational needs are solid. When something like the current recession, or high oil prices, or job insecurity occur, uncertainty rises and undermines our sense of wellbeing. We shift our focus to the basics – do we have a stable home situation, can we pay the mortgage, do we have a job, can we depend on it, can we afford healthcare, etc.? In short, the consumer mind shifts from Thrive to Survive.
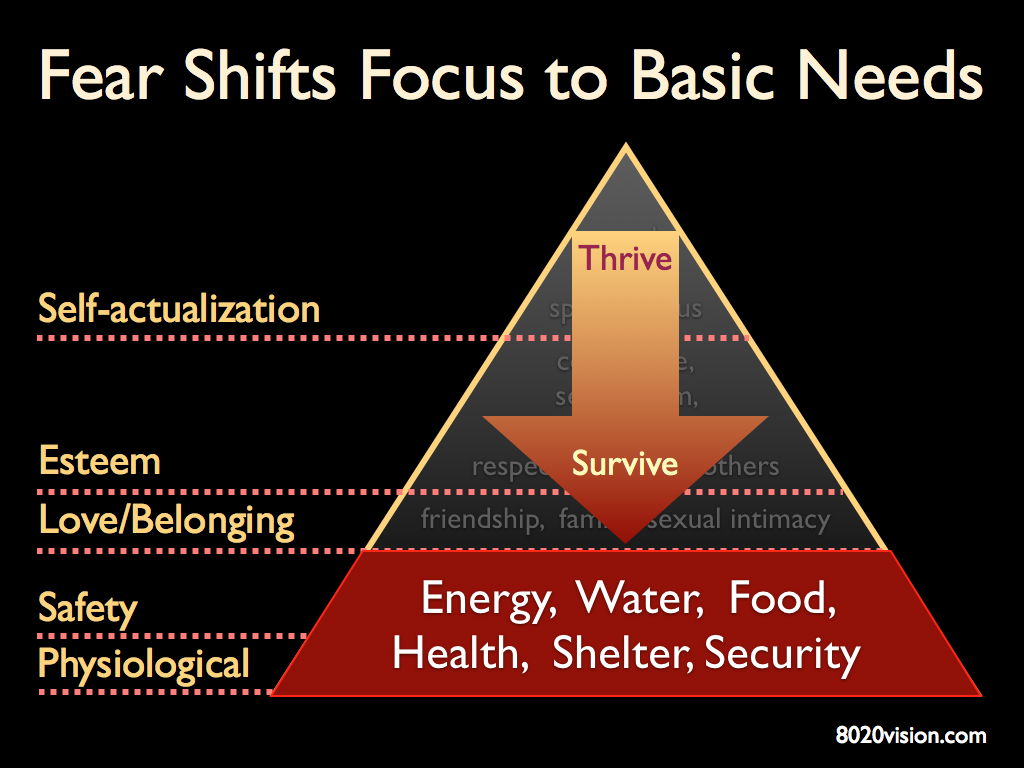
Maslow's Hierarchy of Needs - from thrive to survive

We can see a practical example of this in the Personal Savings Rate.  As the US entered the 2008 recession, the Personal Saving Rate, which has been trending down, did a stunning reversal in a single quarter, pivoting from .8 percent to almost 6 percent.

Personal Saving Rate

Lowenstein details how economic uncertainty impacted refinancing his home.

Highlights from NY Times Article: Paralyzed by Debt

Last month, my wife and I refinanced our mortgage. Though the rate was lower and we could have afforded more debt, we paid down a chunk of the balance. Don’t ask me why — it just felt better to owe less money. Time was, such thrift would have been hailed as patriotic. Now it threatens the economic recovery. Less borrowing means less to spend.
Suppose everybody did this? Well, it turns out, everybody has. Eschewing trips to the mall, Americans are paying off credit-card balances and home-equity lines. Despite low rates, mortgage demand has plummeted.

  • 12.5% of household after-tax income is devoted to repaying debts (source: The Federal Reserve Board, 2010)
  • Half of American workers have suffered a job loss or a cut in hours or wages over the past 30 months.
  • The economy is Deleveraging. Credit in the economy is shrinking, as opposed to the normal state of affairs, in which, each quarter, people borrow more money and banks issue more loans.

Remarkably, this deleveraging has been going on for nearly two years. Ordinary Americans are behaving just as the banks they love to excoriate — having, formerly, assumed too much risk, they are going into hibernation. If credit, in the words of the writer James Grant, is money of the mind, people have become psychologically indisposed to minting it.

  • Total household credit has contracted for seven straight quarters.
  • Mortgage debt is down $462 billion from the peak, which it reached in November 2008.
  • Bank-card borrowings, which peaked two months later, are off $126 billion.
  • Auto loans have fallen $122 billion; home-equity lines, $77 billion.

As Stephanie Pomboy, publisher of the newsletter Macro Mavens, has pointed out, government transfers like stimulus spending and tax credits masked the effects of diminishing credit for a while. That is to say, even if people were unwilling to borrow, they were happy to spend money they got from the government. Now that government supports are being pulled away, the effects of deleveraging are in plain view. Home and car sales are plummeting again. Job growth has shrunk to a sliver. Personal bankruptcies are soaring. Deflation, a dangerous state of economic dead air, when prices fall from lack of demand, is a distinct possibility.

  • In 2001, household debt reached a par with annual after-tax household income. (The average family owed what it earned.) By the peak of the bubble, in 2008, borrowings had surged to 36 percent more than income.

Which raises the issue: how much of that debt will have to be repaid before people return to their customary, and stimulative, profligacy? Thus far, we have undone only a portion of the excess. Household debt now stands at 26 percent more than income — still very high by historical standards. “There is no magical level where it should be,” says David Resler, an economist with Nomura Securities. “There is no clear equilibrium.”

  • To return to the status quo of before the housing boom — say, back to debt to income ratios prevailing in 2000 — it would take five more years of deleveraging at the current rate.

McKinsey recently published an excellent review of the global deleveraging process that began in 2008.  From their report:

Americans steadily increased their debt levels for a good six decades, but it wasn’t until the turn of the millennium that the ratio of household debt to income really soared. Yet by the second quarter of 2011, three years after the start of the global economic crisis, the US ratio had fallen 11 percent from its peak. At the current rate of deleveraging, it would return to trend as of mid-2013—a conclusion buttressed by a comparison between US households today and those of Sweden and Finland during the 1990s, when the two Scandinavian countries endured similar banking crises, recessions, and deleveraging episodes. In both, the ratio of household debt to income fell by roughly 30 percent from its peak. As the exhibit below shows, the United States has been closely tracking the Swedish experience, while households in Spain and the United Kingdom have only just begun to deleverage. To learn more, read “Working out of debt” (January 2012).
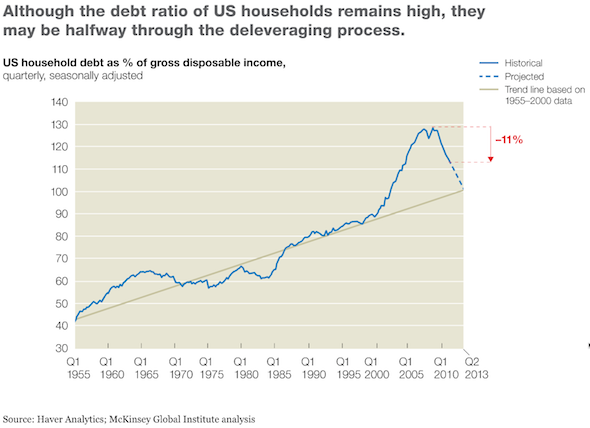
US deleveraging - US household debt as percent of gross disposable income

global deleveraging - US, UK, Spain, Sweden

Rethinking the Measure of Growth

Lat year I posted an article (Nobel Laureate Joseph Stiglitz on Sustainability and Growth) about an interview with economics Nobel laureate Joseph Stiglitz at the Asia Society in New York City. Stiglitz talked about how “what we measure determines what we grow” and the dramatic negative side-effects a metric like GDP can have on societal well-being.

Today, Wayne Arnold at The New York TImes builds on this idea in his article Rethinking the Measure of Growth.

Highlights from NY Times Article

  • The quest for more plentiful and less expensive oil for fast-growing Asian economies has also brought a wave of offshore drilling from India and the Gulf of Thailand, to Vietnam and Bohai Bay, on the northeast coast of China.
  • In considering this risk and the increasing evidence of the toll that rapid economic development is already taking on Asia’s environment, economists and other experts in Asia have taken up the call to re-examine the prominence of economic growth as a measure of policy success, particularly the use of gross domestic product.
  • Asian governments have become particularly enthralled with gross domestic product (GDP) statistics for validation, becoming what Vishakha Desai, the president and chief executive of the Asia Society in New York, has called “G.D.P. junkies.”

For local officials in China, gross domestic product was, until recently, more than just a barometer for gauging policies, it was the measuring stick against which their futures in the ruling Communist Party were determined. Economic growth still ranks as one of the chief criteria for determining party promotions, according to Tan Kong Yam, an economics professor at Nanyang Technological University in Singapore who offers a course for mayors from China.

For such officials, “there is an enormous incentive to promote investments and industrial production,” he said. “This explains why there’s enormous pollution.”

  • Gross domestic product has come in for some particularly hard knocks since the global financial crisis, notably after a report last year whose co-author was Joseph E. Stiglitz, a Nobel laureate in economics, that said reliance on gross domestic product had blinded governments to the increasing risks in the world economy since 2004.
  • Overlooking that risk has possibly cost future economic growth, the report said, and has contributed to a looming environmental crisis.

“Market prices are distorted by the fact that there is no charge imposed on carbon emissions,” the report said. “Clearly, measures of economic performance that reflected these environmental costs might look markedly different from standard measures.”

Economists in Asia say the debate about gross domestic product misses the point. Gross domestic product as a statistic is sound, they say; what is wrong is the fascination in government with what it measures — the sum total of a nation’s annual production.

“The problem is not G.D.P.,” said Bhanoji Rao, a visiting economics professor at the Lee Kuan Yew School of Public Policy in Singapore. “The problem is the culture of consumption.”

  • Mr. Rao is part of a growing body of economists, largely in academia, who question whether rapid economic growth rates in Asia — from the 10.3 percent expansion in giant-but-poor China to an expected 15 percent growth this year in tiny-but-rich Singapore — are necessarily producing a happier, healthier Asia.
  • Some Asian governments, China’s included, have been trying to recalibrate gross domestic product to include the cost of growth to the environment, creating a green gross domestic product. Such efforts, said Mr. Tan, the Nanyang professor, have been frustrated by the difficulty in determining the future cost of environmental destruction.
  • What is needed instead, some economists say, is a wholesale re-examination of development’s goals. “There needs to be an internal debate within the developing countries about what is the path of development we want to have,” Mr. Rao said.

Andy Xie, a private economist in Shanghai, has long argued that the 1.3 billion people in China cannot realistically hope to live like Americans.

“That statement is truer than ever,” he said.

Beijing, at least, appears to have gotten the message, if its investments in green technology and public transportation are anything to go by. The Communist Party has also revised the promotion criteria for officials so that environmental conditions are included along with gross domestic product.

But economists like Mr. Xie and Mr. Rao warn that even with greener development, the result may still be the same if the goal remains an American-style standard of living. Asia may instead need to carve out a vastly different vision of prosperity that does not rely on ever-increasing levels of material consumption.

NOAA: June, April to June, and Year-to-Date Global Temperatures are Warmest on Record

Climate change news from the National Oceanic and Atmospheric Administration (NOAA):

15 July 2010

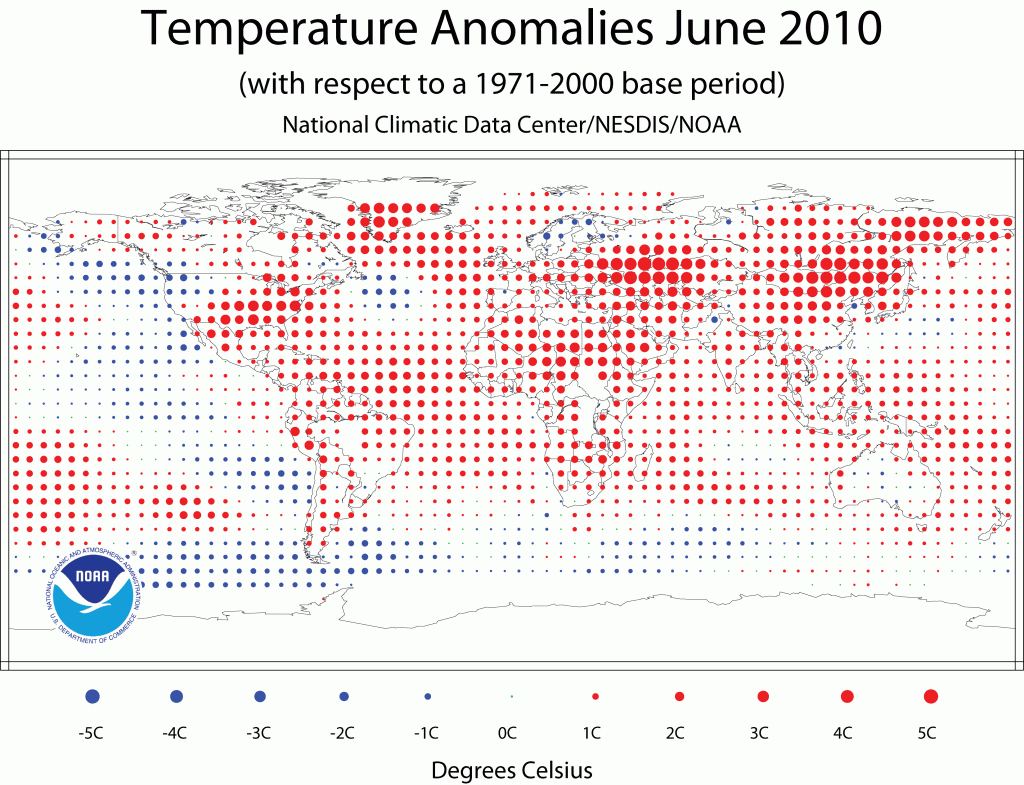
Last month’s combined global land and ocean surface temperature made it the warmest June on record and the warmest on record averaged for any April-June and January-June periods, according to NOAA. Worldwide average land surface temperature was the warmest on record for June and the April-June period, and the second warmest on record for the year-to-date (January-June) period, behind 2007.

The monthly analysis from NOAA’s National Climatic Data Center, which is based on records going back to 1880, is part of the suite of climate services NOAA provides government, business and community leaders so they can make informed decisions.

Scientists, researchers and leaders in government and industry use NOAA’s monthly reports to help track trends and other changes in the world’s climate. This climate service has a wide range of practical uses, from helping farmers know what and when to plant, to guiding resource managers with critical decisions about water, energy and other vital assets.

NOAA Temperature Anomalies June 2010
(source: NOAA National Climatic Data Center)

The Guardian did a nice job of going deeper into the story. Here are highlights from their article:

  • The figures released last night by the National Oceanic and Atmospheric Administration (NOAA) suggest that 2010 is now on course to be the warmest year since records began in 1880.
  • Scientists expressed surprise that the June land surface temperature exceeded the previous record by 0.11C (0.20F). “This large difference over land contributed strongly to the overall global land and ocean temperature anomaly,” said John Leslie, a spokesman for NOAA.
  • Separate satellite data from the US National Snow and Ice Data Centre in Colorado shows that the extent of sea ice in the Arctic was at its lowest for any June since satellite records started in 1979.
  • In a further possible sign of a warming world, the Jakobshavn Isbrae glacier, one of the largest in Greenland, lost a 2.7-square mile chunk of ice and retreated one mile between 6-7 July – one of the largest single losses to a glacier ever recorded.
  • The glacier, a tongue of the Greenland ice sheet, has retreated six miles since 2000 and more than 27 miles since 1850. It is believed to be the single largest contributor to sea level rise in the northern hemisphere.
  • Greenland’s ice sheet, a vast body of ancient ice covering 1.7 million sq km, is melting today more rapidly than only a few decades ago. Since 2000, the ice sheet is calculated to have lost about 1,500 cubic kilometres of water– enough to raise global sea levels by 5mm . If the entire ice sheet melted, the world’s oceans would rise by over 23 feet.
  • Glaciologists expressed surprise at the speed of the break-up of the glacier: “This is unusual because it occurs on the heels of a warm winter that saw no sea ice form in the surrounding bay … it lends credence to the theory that warming of the oceans is responsible for the ice loss observed throughout Greenland and Antarctica,” said NASA scientist Thomas Wagner.

Present concentration of carbon dioxide gas in the atmosphere is 31 per cent above pre-industrial levels.

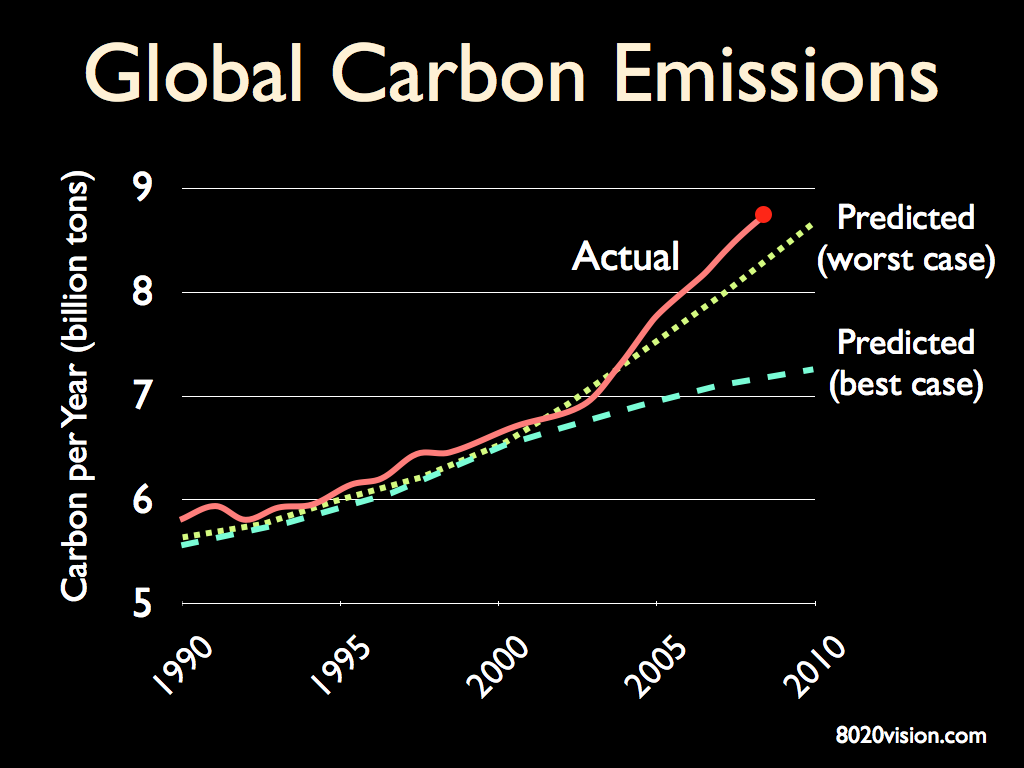
Referring to the chart below, current emissions are tracking above the most intense fossil fuel emission scenario established by the IPCC Special Report on Emissions Scenarios-SRES (2000).

Global Carbon Emissions 2010
(source: EIA, CDIAC, Raupach et al. 2007, Proceedings of National Academy of Sciences)

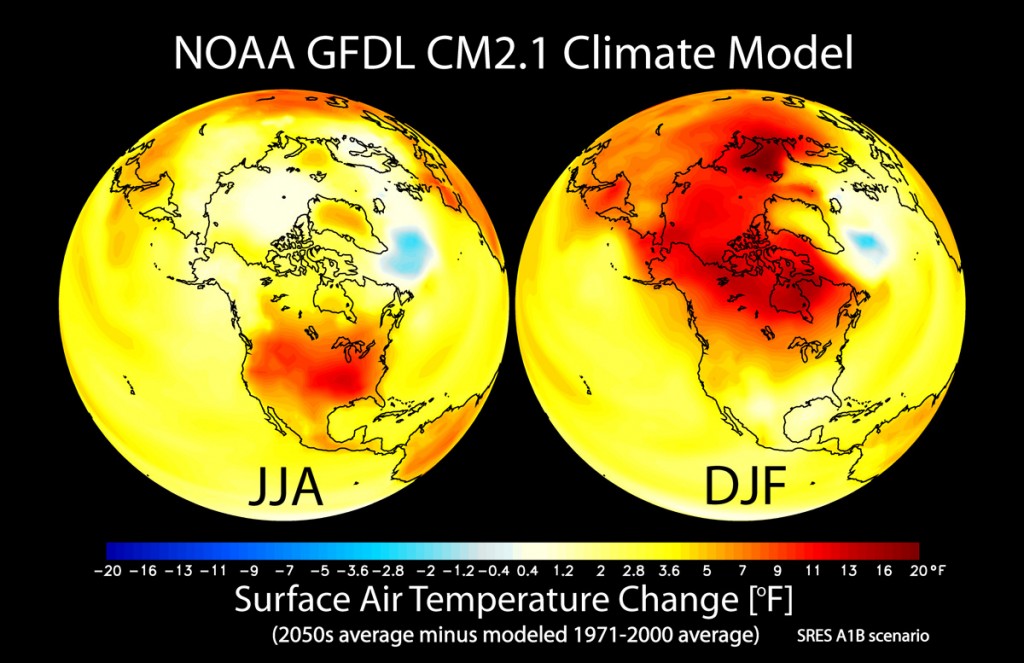
Referring to the chart below, NOAA has modeled change in seasonal mean surface air temperature from the late 20th century (1971-2000 average) to the middle 21st century (2051-2060). The left panel shows changes for June July August (JJA) seasonal averages, and the right panel shows changes for December January February (DJF). The simulated surface air temperature changes are in response to increasing greenhouse gases and aerosols based on a “middle of the road” estimate of future emissions. As we can see from the chart above, we are exceeding “middle of the road” substantially.

surface air temps change 2050
(source: NOAA - National Oceanic and Atmospheric Administration)

Red areas on the map represent a 20 degree increase from averages in the late 20th century. This has major implications for food production, water, and energy, not to mention business as usual.

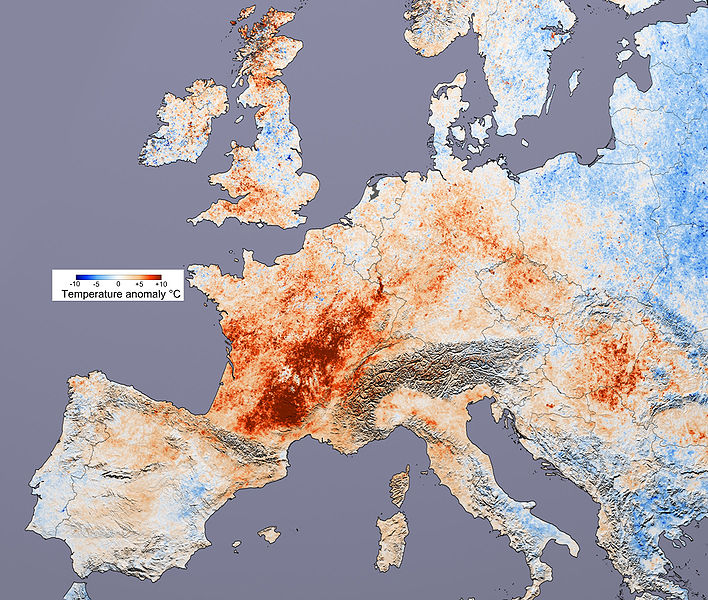
For a hint of what to expect, look at the infamous 2003 heat wave that struck Europe for just 7 days:

  • 30,000 heat-related deaths, 14,802 in Fance alone.
  • Extensive forest fires (10% of Portugal forests burned).
  • Temperatures ranged from 104 ºF to 118 ºF (40 ºC to 48 ºC).
  • Melting glaciers in the Alps caused avalanches and flash floods in Switzerland.
  • Extensive crop loss of wheat across Europe (13% to 80%).

Here’s a picture of the temperature anomaly across Europe during the heat wave. (N.B. Red indicates +10 ºC, +18ºF anomaly)

2003 European heat wave
(source: NASA)

For related articles and books, see:

Climate Change May Reduce Protein in Crops

Recommended Reading