Climate Change, Food, and Wildfires

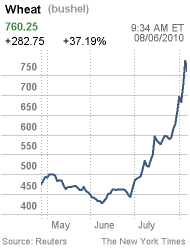
Price of WheatAn article in the New York Times (Russia, Crippled by Drought, Bans Grain Exports) details Russia’s struggle with severe drought. Though any particular instance of drought can’t be directly linked to climate change and global warming, the world is warming, and instances of drought and associated wildfires, water shortages and crop loss are trending up.

The article highlights the tight coupling between food, water, and a warming world. It also shows how one countries problem affects us all, for example, Russia’s ban on grain exports has doubled the price of wheat worldwide.

For more on climate change and impact on food, see:

NOAA: June, April to June, and Year-to-Date Global Temperatures are Warmest on Record

State of the Climate: Hottest Decade on Record

Water Scarcity in the US

Climate Change May Reduce Protein in Crops

Highlights of the article – Russia, Crippled by Drought, Bans Grain Exports

  • Prime Minister Vladimir V. Putin on Thursday banned all exports of grain after millions of acres of Russian wheat withered in a severe drought, driving up prices around the world and pushing them to their highest level in two years in the United States.
  • Russia is suffering from the worst heat wave since record-keeping began here more than 130 years ago.
  • The export ban was widely seen as one of a series of populist moves by Mr. Putin to address rising resentment over the calamitous heat wave and the fires it has spawned.
  • Wheat prices have soared by about 90 percent since June because of the drought in Russia and parts of the European Union, as well as floods in Canada, and the ban pushed prices even higher. Exports from Ukraine, another major exporter, are down sharply this year.

State of the Climate: Hottest Decade on Record

The National Oceanic and Atmospheric Administration (NOAA) just released their annual State of the Climate report.

A comprehensive review of key climate indicators confirms the world is warming and the past decade was the warmest on record. More than 300 scientists from 48 countries analyzed data on 37 climate indicators, including sea ice, glaciers and air temperatures. A more detailed review of 10 of these indicators, selected because they are clearly and directly related to surface temperatures, all tell the same story: global warming is undeniable.

The findings do not include data from 2010, which is on pace to exceed the highest annual average global temperature ever recorded, NOAA said. This summer’s weather has been defined by extreme heat events in the eastern United States, Europe, Russia, China, Japan and the Middle East.

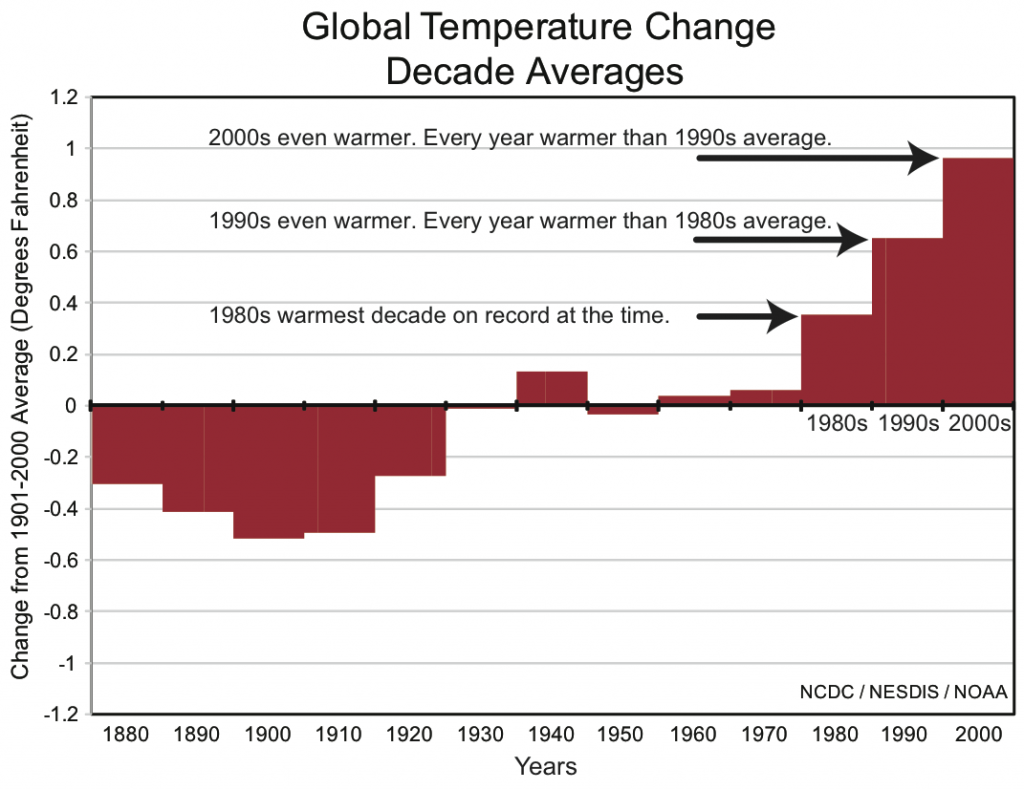
According to the report, each decade since the 1980s has been progressively warmer than the last, with an average warming of about one-fifth of a degree Fahrenheit per decade.

Global Temperature Change Decades

“The temperature increase of one degree Fahrenheit over the past 50 years may seem small, but it has already altered our planet,” said Deke Arndt, co-editor of the report and chief of the Climate Monitoring Branch of NOAA’s National Climatic Data Center. “Glaciers and sea ice are melting, heavy rainfall is intensifying and heat waves are more common.”

The pace of climate change is quickening. If this was your temperature, you would go to a doctor. If this was your car radiator temperature, you would pull over.

The challenge here is that these changes are not happening in minutes or hours, so they lack the emergency quality that galvanizes us into action. And yet, the impact to our water, food production, health, property, and quality of life will be enormous.

In Clayton Christensen’s book, The Innovator’s Dilemma, he talks about disruptive technology that changes ‘business as usual’. Some businesses fall, and some rise, depending how they respond to the disruption.

Think of this as the ultimate disruptor. How is your organization thinking about climate change? What metrics do you use to understand and track the trends? How will you minimize the impact and risk? What opportunities are their for innovation?

For more on impact, read Water Scarcity in the US, Sustainable Energy Security: Strategic Risks and Opportunities for Business, and Climate Change May Reduce Protein in Crops.

Interactive Climate Map from Google Shows Future Impact of Climate Change

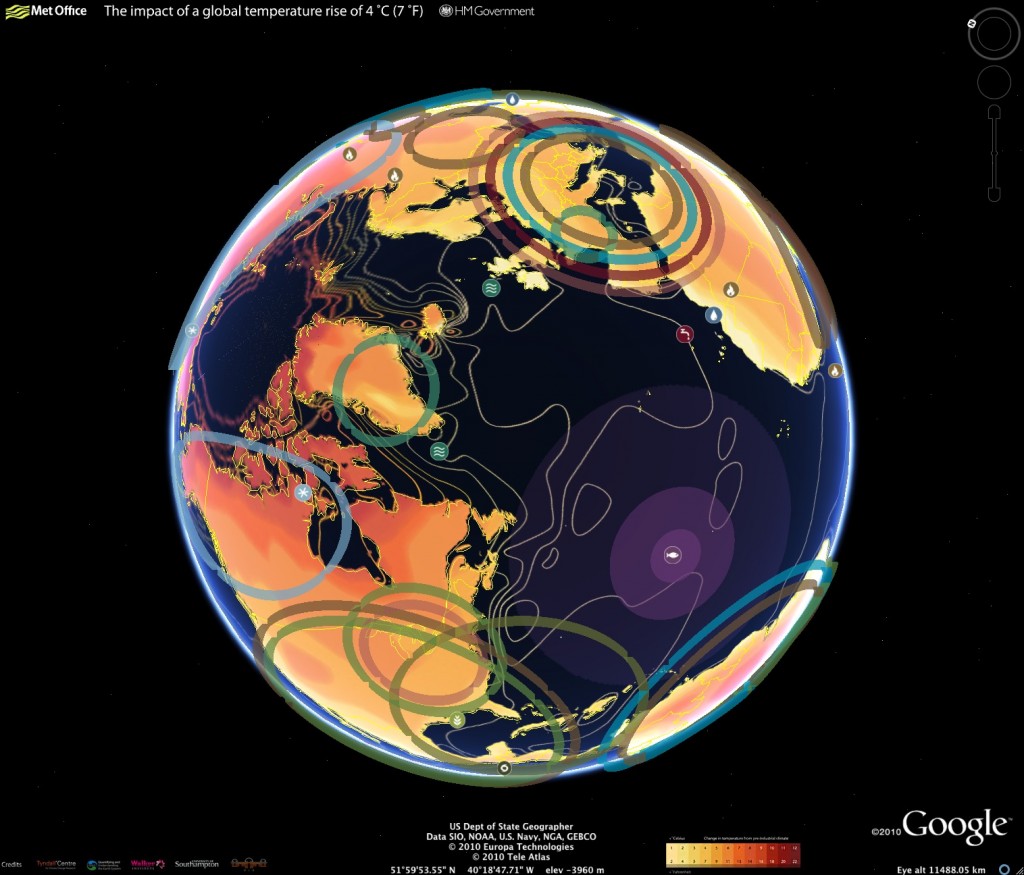
Using Google Earth, the UK Foreign Office (FCO) and the Department of Energy and Climate Change (DECC) have released an interactive climate map that provides insight on the impact of climate change around the world.

The Google Earth map shows how the world would be affected by a global average temperature increase of 4C. It illustrates rising water levels and reduced crop yields in different parts of the world if temperatures are not curbed by cutting greenhouse gases.

The map service is directed at a global audience; it details the work of the scientists working in countries across Asia, Latin America and Africa. It uses Met Office data, and will also feature Foreign Office’s own work on the economics of climate change that it has been doing with the likes of the Asian Development Bank. The map is interactive, allowing you to roam the planet and explore projected impact and view video providing climate scientists and researchers discussing impact details.

Articles detailing the project can be found at The Telegraph and the Financial TImes.  The online map is available here. If you don’t have Google Earth installed, you can download a copy here.
Climate Change Impact

NOAA: June, April to June, and Year-to-Date Global Temperatures are Warmest on Record

Climate change news from the National Oceanic and Atmospheric Administration (NOAA):

15 July 2010

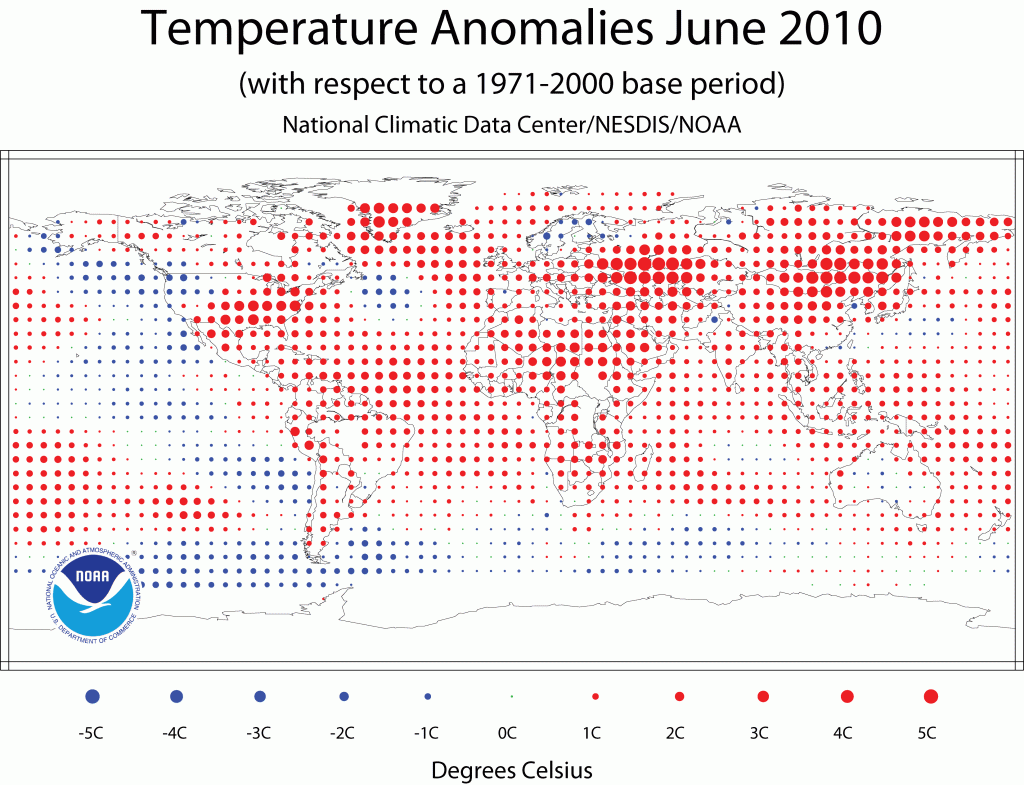
Last month’s combined global land and ocean surface temperature made it the warmest June on record and the warmest on record averaged for any April-June and January-June periods, according to NOAA. Worldwide average land surface temperature was the warmest on record for June and the April-June period, and the second warmest on record for the year-to-date (January-June) period, behind 2007.

The monthly analysis from NOAA’s National Climatic Data Center, which is based on records going back to 1880, is part of the suite of climate services NOAA provides government, business and community leaders so they can make informed decisions.

Scientists, researchers and leaders in government and industry use NOAA’s monthly reports to help track trends and other changes in the world’s climate. This climate service has a wide range of practical uses, from helping farmers know what and when to plant, to guiding resource managers with critical decisions about water, energy and other vital assets.

NOAA Temperature Anomalies June 2010
(source: NOAA National Climatic Data Center)

The Guardian did a nice job of going deeper into the story. Here are highlights from their article:

  • The figures released last night by the National Oceanic and Atmospheric Administration (NOAA) suggest that 2010 is now on course to be the warmest year since records began in 1880.
  • Scientists expressed surprise that the June land surface temperature exceeded the previous record by 0.11C (0.20F). “This large difference over land contributed strongly to the overall global land and ocean temperature anomaly,” said John Leslie, a spokesman for NOAA.
  • Separate satellite data from the US National Snow and Ice Data Centre in Colorado shows that the extent of sea ice in the Arctic was at its lowest for any June since satellite records started in 1979.
  • In a further possible sign of a warming world, the Jakobshavn Isbrae glacier, one of the largest in Greenland, lost a 2.7-square mile chunk of ice and retreated one mile between 6-7 July – one of the largest single losses to a glacier ever recorded.
  • The glacier, a tongue of the Greenland ice sheet, has retreated six miles since 2000 and more than 27 miles since 1850. It is believed to be the single largest contributor to sea level rise in the northern hemisphere.
  • Greenland’s ice sheet, a vast body of ancient ice covering 1.7 million sq km, is melting today more rapidly than only a few decades ago. Since 2000, the ice sheet is calculated to have lost about 1,500 cubic kilometres of water– enough to raise global sea levels by 5mm . If the entire ice sheet melted, the world’s oceans would rise by over 23 feet.
  • Glaciologists expressed surprise at the speed of the break-up of the glacier: “This is unusual because it occurs on the heels of a warm winter that saw no sea ice form in the surrounding bay … it lends credence to the theory that warming of the oceans is responsible for the ice loss observed throughout Greenland and Antarctica,” said NASA scientist Thomas Wagner.

Present concentration of carbon dioxide gas in the atmosphere is 31 per cent above pre-industrial levels.

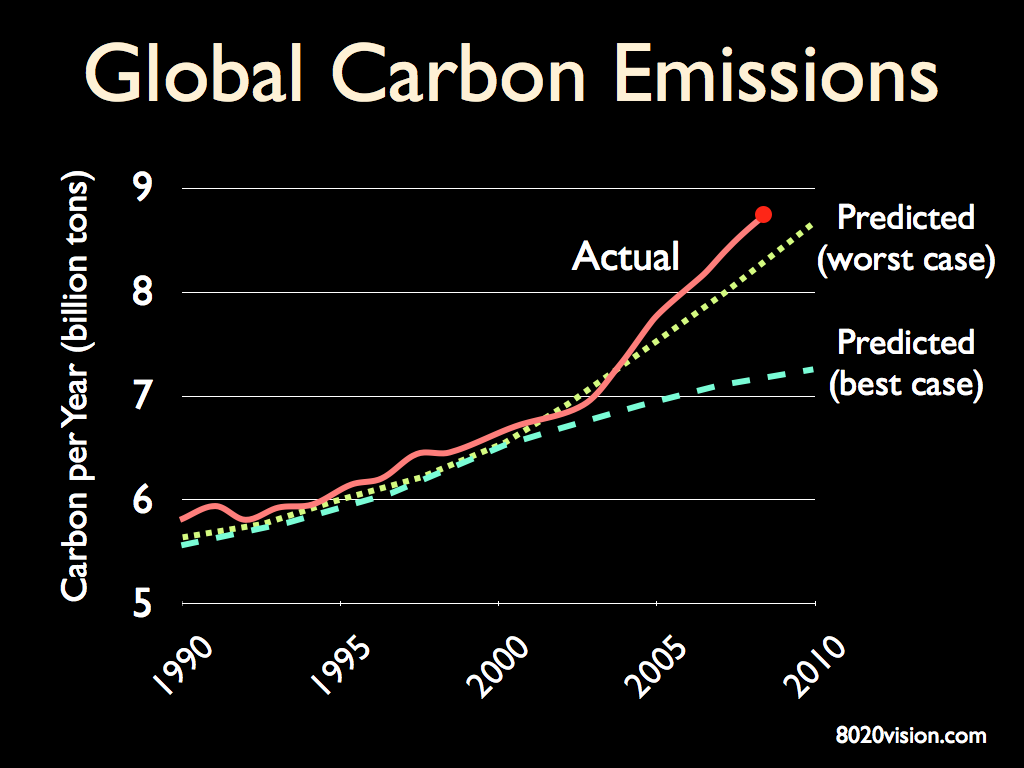
Referring to the chart below, current emissions are tracking above the most intense fossil fuel emission scenario established by the IPCC Special Report on Emissions Scenarios-SRES (2000).

Global Carbon Emissions 2010
(source: EIA, CDIAC, Raupach et al. 2007, Proceedings of National Academy of Sciences)

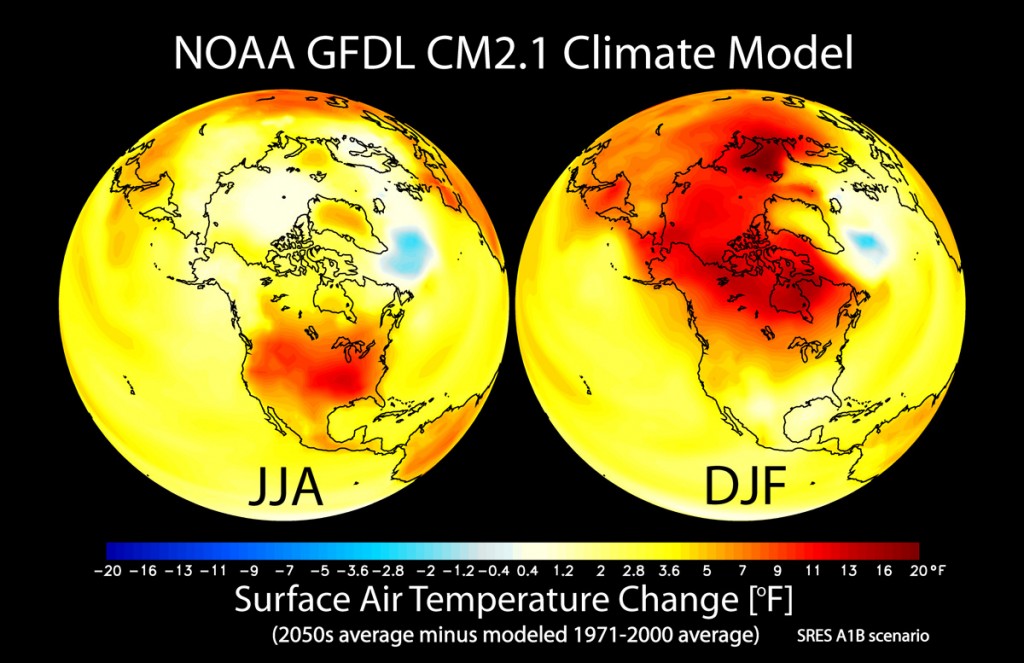
Referring to the chart below, NOAA has modeled change in seasonal mean surface air temperature from the late 20th century (1971-2000 average) to the middle 21st century (2051-2060). The left panel shows changes for June July August (JJA) seasonal averages, and the right panel shows changes for December January February (DJF). The simulated surface air temperature changes are in response to increasing greenhouse gases and aerosols based on a “middle of the road” estimate of future emissions. As we can see from the chart above, we are exceeding “middle of the road” substantially.

surface air temps change 2050
(source: NOAA - National Oceanic and Atmospheric Administration)

Red areas on the map represent a 20 degree increase from averages in the late 20th century. This has major implications for food production, water, and energy, not to mention business as usual.

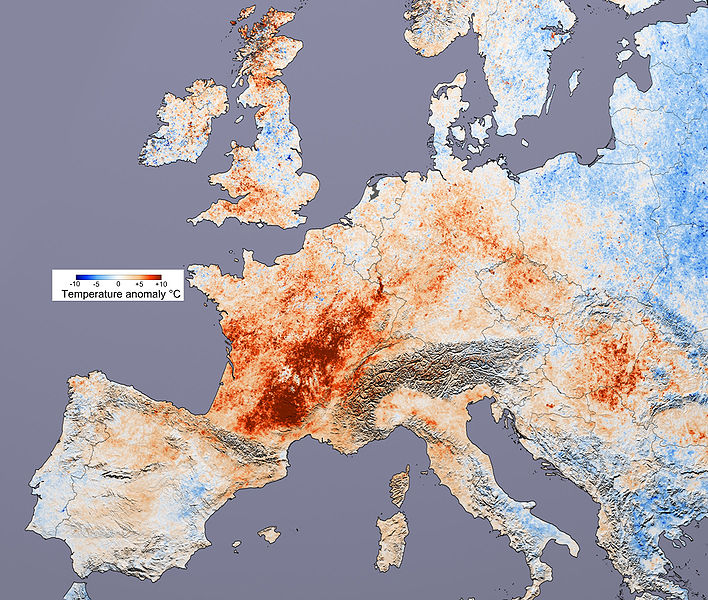
For a hint of what to expect, look at the infamous 2003 heat wave that struck Europe for just 7 days:

  • 30,000 heat-related deaths, 14,802 in Fance alone.
  • Extensive forest fires (10% of Portugal forests burned).
  • Temperatures ranged from 104 ºF to 118 ºF (40 ºC to 48 ºC).
  • Melting glaciers in the Alps caused avalanches and flash floods in Switzerland.
  • Extensive crop loss of wheat across Europe (13% to 80%).

Here’s a picture of the temperature anomaly across Europe during the heat wave. (N.B. Red indicates +10 ºC, +18ºF anomaly)

2003 European heat wave
(source: NASA)

For related articles and books, see:

Climate Change May Reduce Protein in Crops

Recommended Reading

Creating Leaders Great at Performing in Uncertainty without a Clue as to Why

There is an interesting phenomena going on in some of the major business schools in Europe. In some – you are not allowed to mention environmental factors as a major catalyst for new business models/thinking. It is “understood” that as a lecturer, you inspire the students with fresh thinking but only so far. Go further, and people just roll their eyes and pigeon-hole you as a treehugger.

Here are three quotes from top business leaders:

“The era of ‘abundance’ is over. The future will see our natural resources, from oil to food, having some level of restriction placed on them.”Andy Bond, CEO, Asda (May 2009)

“We must rapidly wean ourselves off our dependence on coal and fossil fuels.” – Richard Branson, announcing investment of all profits from Virgin transport business, estimated at $3 billion over 10 years, to be invested in fighting global warming. (21 September 2006)

“Sustainability is here to stay or we may not be.”Niall Fitzgerald, UK CEO, Unilever

Now, none of these guys are particularly treehuggy. And most MBAs would give their eyeteeth to fill the shoes of these guys – and yet – in many MBA programs – coverage of sustainability issues is absent, apologetic, sidelined, or sketchy.

Let’s stop tiptoeing around the obvious. Business leaders can handle the truth. Though there is uncertainty on what the impact will be, climate change is a global issue that will impact business. Period.

In 2008 the US Director of National Intelligence (DNI) presented to Congress the DNI report National Intelligence Assessment on the National Security Implications of Global Climate Change to 2030. Here are a few excerpts:

“The United States depends on a smooth-functioning international system ensuring the flow of trade and market access to critical raw materials such as oil and gas, and security for its allies and partners. Climate change and climate change policies could affect all of these—domestic stability in a number of key states, the opening of new sea lanes and access to raw materials, and the global economy more broadly—with significant geopolitical consequences.”

“In addition, anticipated impacts to the Homeland—including possible increases in the severity of storms in the Gulf, increased demand for energy resources, disruptions in US and Arctic infrastructure, and increases in immigration from resource-scarce regions of the world—are expected to be costly. Government, business, and public efforts to develop mitigation and adaptation strategies to deal with climate change — from policies to reduce greenhouse gasses to plans to reduce exposure to climate change or capitalize on potential impacts—may affect US national security interests even more than the physical impacts of climate change itself.”

“Climate change is a threat multiplier in 
the world’s most unstable regions.”

“From a national security perspective, climate change has the potential to affect lives (for example, through food and water shortages, increased health problems including the spread of disease, and increased potential for conflict), property (for example through ground subsidence, flooding, coastal erosion, and extreme weather events), and other security interests.”

These leaders are talking about fundamental shifts in ‘givens’ that require action, a joined up way of behaving, new ways of thinking, and new approaches. And our top business schools should be on the leading edge.

I first got interested in business schools ignoring the big elephant in the classroom two years ago when I was delivering a course on dominant business metaphors and implementing change. I wanted to say one line – one sentence inviting students to ponder how the nature of sustainability planning would be different if organisations, in addition to approaching business as a ‘competitive sport’, also approached it as a living organism. The professor who brought me in said ‘no’ – that the MBAs would feel they were being hijacked away from the course they had paid for. There was a specific elective for sustainability – and outside of that – best not to mention those issues.

Over the past few months, I’ve been speaking with several top MBA programs in Europe. Each is saying that leaders need, more than at any other time in history, to be able to lead in the presence of ambiguity, and to be able to perform collaboratively with high levels of uncertainty. Applied Improvisation skills are rather good for that, which is why I’m there in the first place.

What I find interesting in talking with these top MBA programs is that many are not contextualising the WHY of this new emphasis. Not addressing why managers/leaders would need to be so good at ambiguity.

“Growth for the sake of growth is the ideology of the cancer cell.” – Edward Abbey

I sat up when I saw this quote. It was refreshing to see in a lecture to potential MBAs at a leading business school in the Netherlands a few weeks ago. During my time at the school, two of the guest lecturers talked about sustainability – kind of…

The first lecturer used the Abbey quote (Abbey is a renown outspoken sustainability activist) and talked about the need to create ‘sustainable businesses’ quickly dismissed the notion of ‘sustainable’ as being linked to any ‘environmental’ issues… – it was about a business which can keep going, despite ‘adversity’. Given what scientists are saying about increasing disruptions over climate change, peak oil, peak minerals, peak water, how could adversity due to these factors not be mentioned?

The other lecturer had just hosted a biomimicry event two weeks before and deeply cared about the environment and sustainability. He works with top leaders in the best companies around the world on developing leadership skills. In his session, he talked about the profound need for leaders to be comfortable leading in the presence of ambiguity, but didn’t say why. In the break he confided that there are some groups with which you cannot talk about the environment directly. He had been gently testing the water with that day’s group and found he could mention it a bit…but only a bit. Several people were there for the express purpose of earning more money with an emphasis on value extraction, not particularly wealth creation/exchange.

Contextualising is a vital part of learning. The military does this routinely in their simulations – creating real world scenarios in the classroom. If we are facing a series of challenges (climate change, scarcity of water, oil, minerals, etc.) we must mention that as part of what leaders will face.

One initiative that gives me hope is the UN Principles for Responsible Management Education (PRME) initiative. The head of a leading MBA program in the UK turned me on to it. Finally – a global effort is being made to transform business schools and the Assocation of MBAs is part of it. In theory – that should mean that the taboo-ness of sustainability issues being explicitly mentioned, or mentioned only in specific electives – disappears.

As I continue to work with MBA programs, I will keep you posted on what I see going forward in this arena. And if you know of any best practice in this area – please post it here. Let me know!

“Unless we change direction, we are likely to end up where we are going.” – Chinese proverb

© July 2010 by Belina Raffy
Shale Gas Exploration: The Coming Storm

When you see three mainstream media (Vanity Fair, HBO, and Bloomberg) covering the esoteric practice of hydraulic-fracturing (also know as “fracking”), pay attention. Vanity Fair’s report, A Colossal Fracking Mess; HBO’s report, Gasland; and Bloomberg’s report, Shale Game, all detail the nasty practice of fracking – a process used to release natural gas and oil from the earth.

How nasty is fracking? Watch this amazing video of a homeowner demonstrating one of the toxic side effects of Fracking taking place on land near this man’s home.

This video was posted a year ago, and has had about 130,000 views. Though it took a year for the story to hit the mainstream media – the cats out of the bag.

Burning water is just one of the side effects of fracking. Tests of fracking runoff show presence of benzene, ethylbenzene, toluene, boric acid, monoethanolamine, xylene, diesel-range organics, methanol, formaldehyde, hydrochloric acid, ammonium bisulfite, 2-butoxyethanol, and 5-chloro-2-methyl-4-isothiazotin-3-one. (Recently, in congressional testimony, drilling companies have confirmed the presence of many of these chemicals.) In the Vanity Fair article, Theo Colborn, a noted expert on water issues and endocrine disruptors, said that at least half of the chemicals known to be present in Fracking fluid are toxic; many of them are carcinogens, neurotoxins, endocrine disruptors, and mutagens.

HBO’s Gasland is a detailed journey around America, visiting the various communities where shale gas exploration is having an impact on health and wellbeing of the community. Special attention is given to the Marcellus Shale, which poses high risk to ground water for residents of Pennsylvania and New York.  All three reports detail this.

Each well needs 82 tons of assorted chemicals to get it producing. New York has banned shale gas drilling statewide until it adopts new rules. “We firmly believe, based on the best available science and current industry and technological practices, that drilling cannot be permitted in the city’s watershed,” Mayor Michael Bloomberg said in an April.

While the Vanity Fair and Bloomberg reports provide for gripping reading, Gasland’s use of video and narrative delivers a powerful compelling punch. After watching, I was thinking how grateful I was to not live in any of the numerous communities exposed to the toxic side effects of shale gas exploration.

Dimock Township in Pennsylvania is one of the towns that features in all three reports. The Bloomberg report says:

Victoria Switzer, who moved to Dimock Township, Pennsylvania, to build a $350,000 dream home with her husband, Jimmy, in 2004, had no idea how shale gas would consume her village of 1,400.

She says she found so much methane in her well that her water bubbled like Alka-Seltzer. Neighbor Norma Fiorentino says methane in her well blew an 8-inch-thick (20-centimeter-thick) concrete slab off the top. The $180 bonus Cabot paid to drill on Switzer’s 7.2 acres (2.9 hectares) and the $900 in royalties she gets each month don’t compensate, she says.

To paraphrase Ronald Reagan, “The 10 most terrifying words in the English language are ‘I’m from the oil company an I’m here to help.’

Transitioning from Fossil Fuels to Renewable Clean Energy

Gas/Oil production is peaking. The easy oil and gas has been consumed. What remains will increasingly be harder to get to and more complicated to extract. Witness the BP Deepwater Horizon debacle in the Gulf. The business of oil/gas extraction will get increasingly messy and rife with political and legal risk.

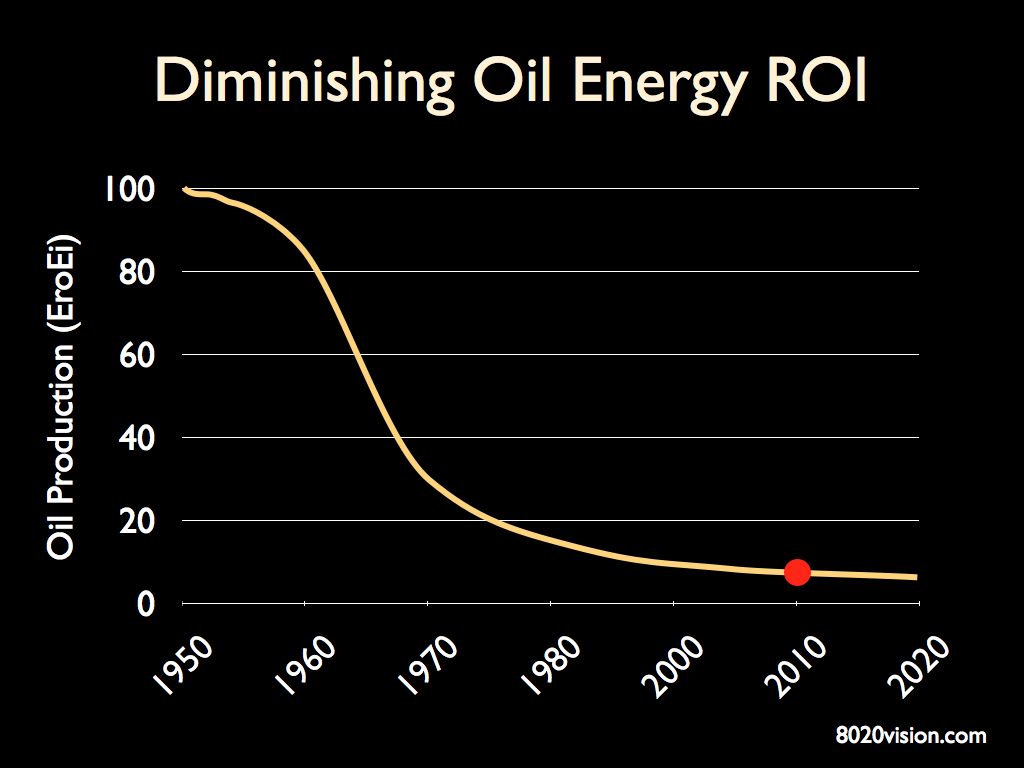
Oil ERoEI Trend

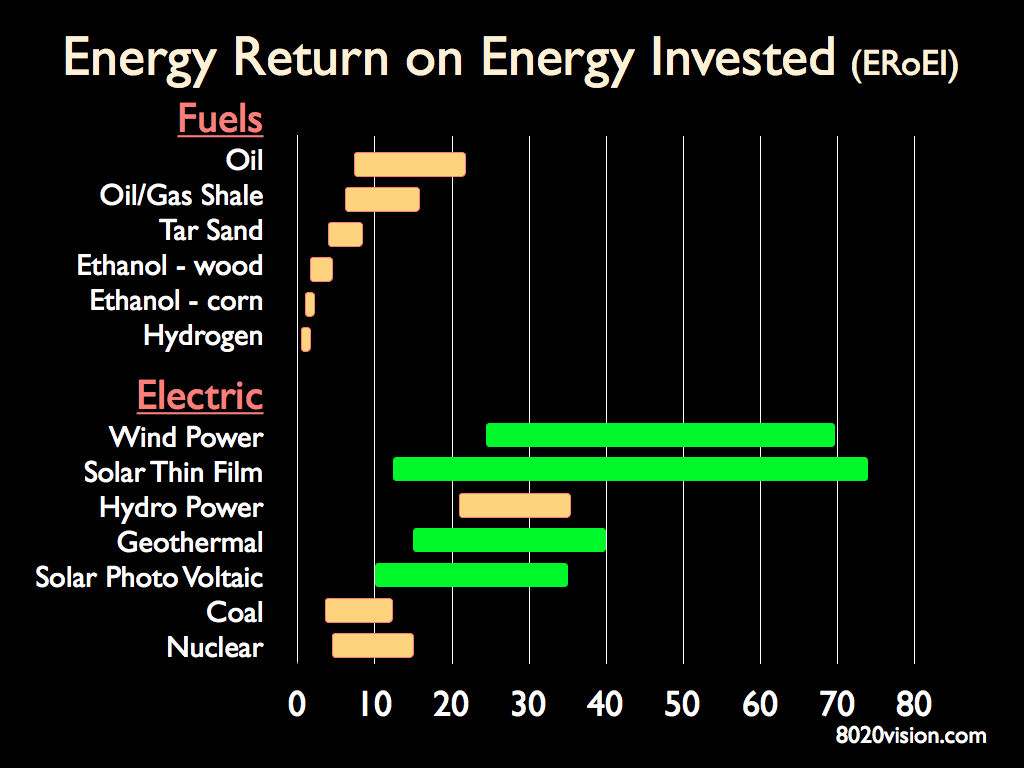
In 1950 we could produce 100 barrels of oil using the energy of 1 barrel of oil.  So the Energy Returned on Energy Invested (ERoEI) was about 100:1.  Today that ratio has fallen below 10:1. Similar low ERoEI can be found for other fossil fuels.  The chart below shows the ERoEI for various forms of energy.  The highest ROI is in wind and solar.  This is where we are seeing double-digit growth.

ERoEI

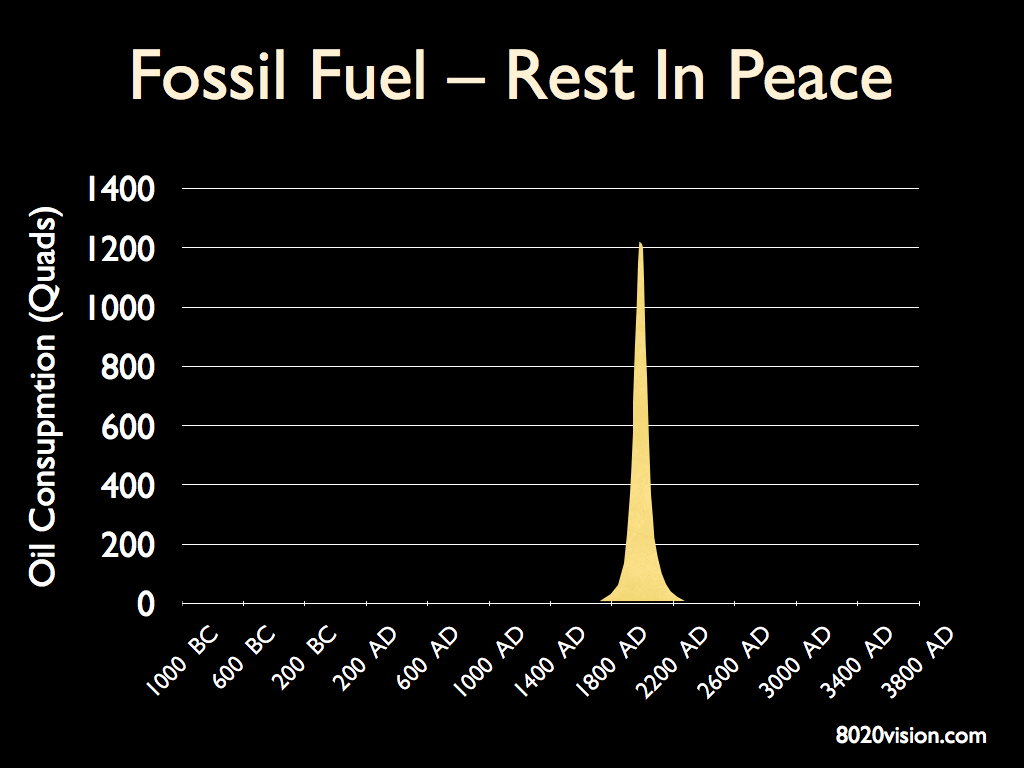
The oil/gas industry has 100 years of inertia propelling it forward. The golden days of fossil fuels are behind us. The industry is a dinosaur now – kept alive by our addiction to fossil fuels. Renewable energy is our future. The faster we can make the transition, the less damage will be done as the beast staggers to its rotten end.

Bryan Walsh, one of my favorite environmental reporters, just published this evenhanded video that looks at some specific examples of toxic fracking related events in Pennsylvania, the heart of east coast gas extraction. The devastating impact on homeowners and communities is tragic.

Fossil fuels – RIP.

Peak Oil


Recommended Reading

Congress Releases Report on Toxic Chemicals Used In Fracking by Jay Kimball