US Energy Use: The Big Picture

This chart from Lawrence Livermore National Laboratory provides a simple clear way to understand how energy is used in the US.

I use this chart a lot in my presentations. It is a classic example of the adage “A picture is worth a thousand words.” On a single page it shows the sources for the energy we use, where it goes, how much is used and how much is wasted.
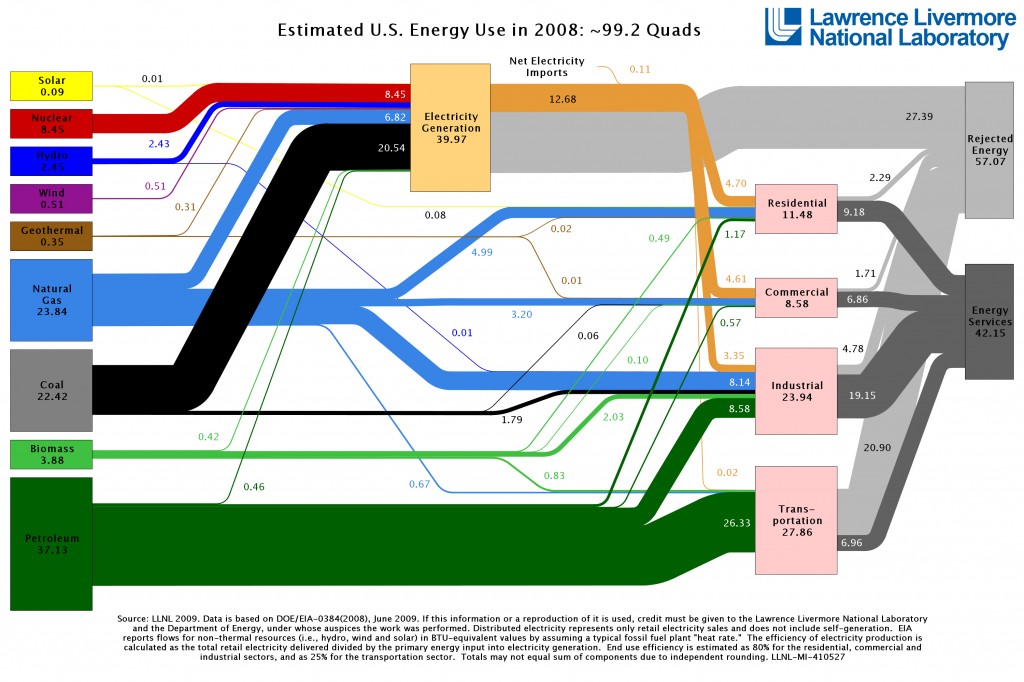
Energy use in US
Energy Use in the US (click to enlarge) (source: Lawrence Livermore National Labratory and DOE)

Some things to note:

  • Energy sources are on the left side – solar, nuclear, hydro, wind, geothermal, natural gas, coal, biomass, petroleum.
  • Energy users are broken in to four categories – residential, commercial, industrial, and transportation.
  • The gray boxes on the right sum up the energy that was used and the energy that was lost (rejected).
  • The width of the lines running from the various energy sources to their destination uses is proportional to the amount of energy used.

Zeroing In On Oil

As can be seen, the lion’s share of US energy consumption comes from fossil fuel sources (oil, coal, natural gas). Of the fossil fuels, oil is the source most in demand, the bulk of which is used by the transportation sector. And oil consumption in the transportation sector is growing fast.
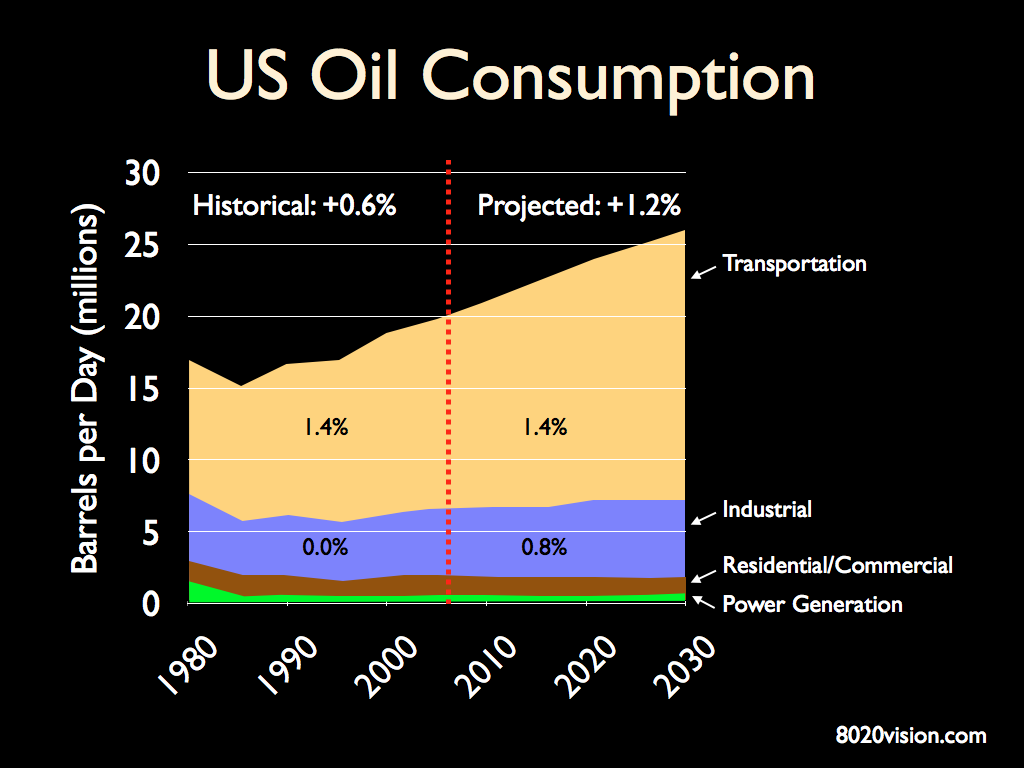
US Oil Consumption By Sector
(source: DOE)

Zooming in to the transportation sector, we can see that most of that oil is used for personal vehicles (cars, light truck and SUVs).
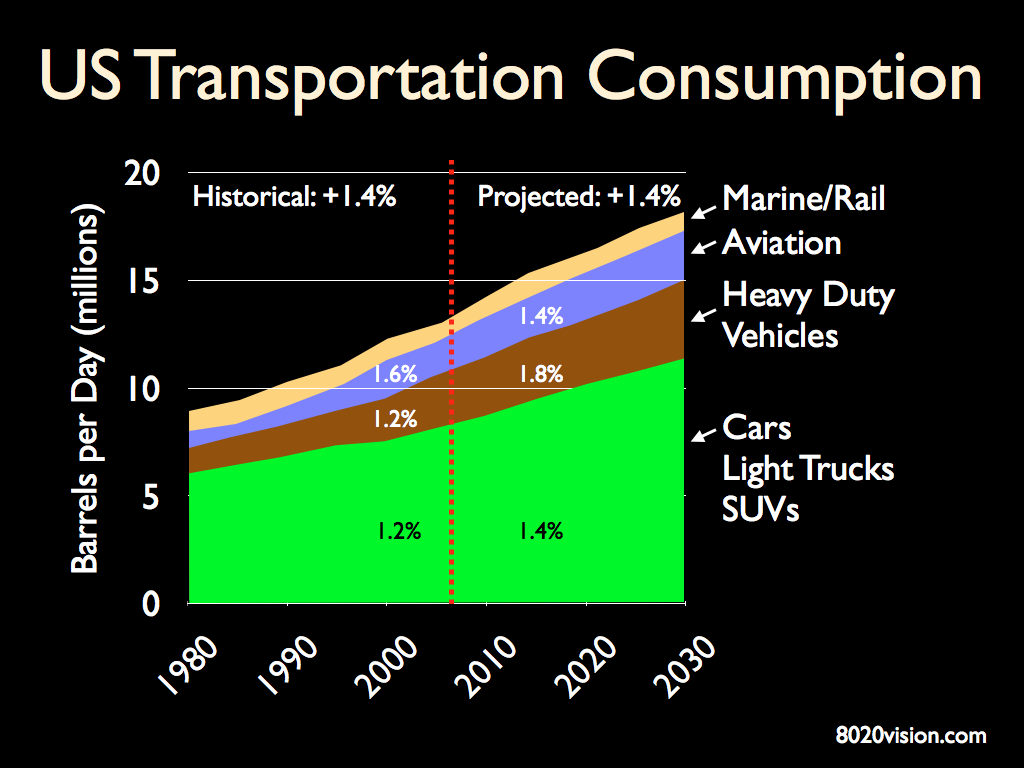
US Oil Consumption Transportation
(source:DOE)

Any attempt to reduce our dependance on oil will require grappling with transportation in general, and personal transportation in particular.

Price of Oil and Consumer Behavior

Personal transportation is 4 to 10 times less efficient than public transportation (commuter rail, trains and buses). When oil prices rise quickly, as they did in 2008 (to over $140 per barrel), consumer behavior shifts rapidly. Automobile manufactures saw their large car sales plummet. Airlines saw their fuel costs skyrocket, and bookings plummet. Commuters embraced public transportation, with many metropolitan areas seeing 30 to 45 percent increases in use of public transportation in just one quarter.
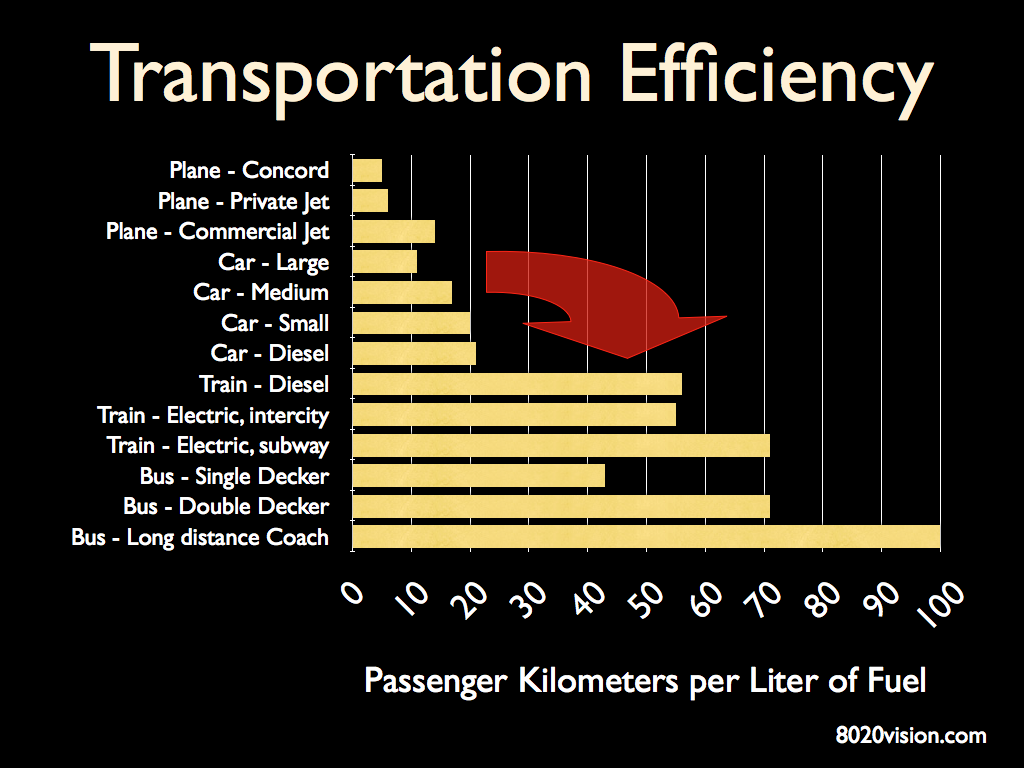
Transportation Efficiency
(source: Lawrence Livermore National Laboratory)

That rapid behavior shift represents risk and opportunity for business and government. For more on that, check out two related posts: Sustainable Energy Security: Strategic Risks and Opportunities for Business and Walmart Partnering with Patagonia on Sustainable Business Practices.

The last century was a time of abundance in energy. There is a new economy of scarcity emerging in the 21st century. Understanding the energy trends shaping our world is essential to managing risk and innovating solutions for business, government and community.
Sustainable Energy Security: Strategic Risks and Opportunities for Business

Lloyds of London, the insurance market, and Chatham House have published a white paper on Sustainable Energy Security that details the risks and opportunities for business.

Lloyd’s CEO, Dr. Richard Ward, doesn’t mince words in his foreword to the white paper:

This report, jointly produced by Lloyd’s 360 Risk Insight programme and Chatham House, should cause all risk managers to pause. What it outlines, in stark detail, is that we have entered a period of deep uncertainty in how we will source energy for power, heat and mobility, and how much we will have to pay for it.

Is this any different from the normal volatility of the oil or gas markets? Yes, it is. Today, a number of pressures are combining: constraints on ‘easy to access’ oil; the environmental and political urgency of reducing carbon dioxide emissions; and a sharp rise in energy demand from the Asian economies, particularly China.

All of this means that the current generation of business leaders – and their successors – are going to have to find a new energy paradigm. Expect dramatic changes:

  • Prices are likely to rise, with some commentators suggesting oil may reach $200 a barrel.
  • Regulations on carbon emissions will intensify.
  • Reputations will be won or lost as the public demands that businesses reduce their environmental footprint.

The growing demand for energy will require an estimated $26 trillion in investment by 2030. Energy companies will face hard choices in deciding how to deploy these funds in an uncertain market with mixed policy messages. The recent Deepwater oil spill shows all too clearly the hazards of moving into ever more unpredictable terrain to extract energy resources. And the rapid deployment of cleaner energy technologies will radically alter the risk landscape. At this precise point in time we are in a period akin to a phony war. We keep hearing of difficulties to come, but with oil, gas and coal still broadly accessible – and largely capable of being distributed where they are needed – the bad times have not yet hit. The primary purpose of this report is to remind the reader that all businesses, not just the energy sector, need to consider how they, their suppliers and their customers will be affected by energy supplies which are less reliable and more expensive.

The failure of the Copenhagen Summit has not helped to instil a sense of urgency and it has hampered the ability of businesses – particularly those in the energy sector – to plan ahead and to make critical new investments in energy infrastructure. I call on governments to identify a clear path towards sustainable energy which businesses can follow.

Independently of what happens in UN negotiating rooms, businesses can take action. We can plan our energy needs, we can make every effort to reduce consumption, and we can aim for a mix of different energy sources. The transformation of the energy environment from carbon to clean energy sources creates an extraordinary risk management challenge for businesses. Traditional models that focus on annual profits and, at best, medium term strategies may struggle. Parts of this report talk about what might happen in 2030 or even 2050 and I make no apology for this. Energy security requires a long term view and it is the companies who grasp this who will trade on into the second half of this century.

Executive Summary

  • Businesses which prepare for and take advantage of the new energy reality will prosper – failure to do so could be catastrophic.
  • Market dynamics and environmental factors mean business can no longer rely on low cost traditional energy sources.
  • China and growing Asian economies will play an increasingly important role in global energy security
  • We are heading towards a global oil supply crunch and price spike.
  • Energy infrastructure will become increasingly vulnerable as a result of climate change and operations in harsher environments.
  • Lack of global regulation on climate change is creating an environment of uncertainty for business, which is damaging investment plans.
  • To manage increasing energy costs and carbon exposure businesses must reduce fossil fuel consumption.
  • Business must address energy-related risks to supply chains and the increasing vulnerability of ‘just-in-time’ models.
  • Investment in renewable energy and ‘intelligent’ infrastructure is booming. This revolution presents huge opportunities for new business partnerships.

A change in the energy market balance between East and West

Advanced economies remain the biggest consumers of primary energy per person but by 2008 non-OECD countries led by China and India had outstripped them in terms of the share of world demand. This shift began in the 1990s, partly because manufacturing shifted eastwards. Meanwhile, lower population growth, de- industrialisation, greater efficiency, higher fuel prices and a concern for the environment are lowering demand for oil-based fuels and coal in the OECD.

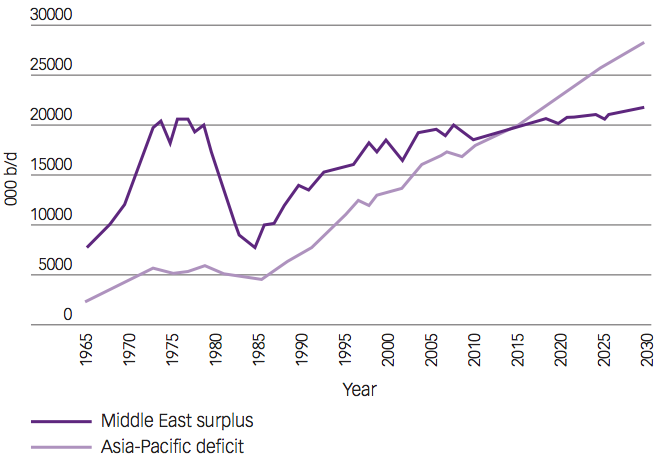
These consumption trajectories mean there is likely to be a tipping point in 2015 when countries in Asia-Pacific need more imported oil in total than the Middle East (including Sudan) can export.

Middle East oil surplus vs Asia-Pacific deficit
Middle East oil surplus vs Asia-Pacific deficit (Source: John Mitchell, Chatham House 2010)

The white paper goes on to detail market forces, energy trends, risk and opportunity.  This is recommended reading for business and government leaders and risk managers.

The Slow Search for Solutions: Lessons from Historical Energy Transitions by Sector and Service

The Basque Centre for Climate Change (BC3) has released a new research report that examines past energy transitions by sector and service to identify features that may be useful for anticipating future transitions. The United Kingdom was the first to make the transition from traditional energy sources to fossil fuel.  The UK experience may help us understand how to transition to a low carbon economy.

Each country will have transition patterns driven by natural resources – coal, oil, wind, tidal, geothermal, etc.  The chart below shows the energy transitions for the UK from 1500 to 2000. Note the early use of wind.  Since the data only goes through 2000, UK’s significant recent investment in wind initiatives is not reflected.

Share of Primary Energy Consumption in the United Kingdom (1500-2000)

Highlights of the BC3 Report

  • The main drivers for the energy transitions were the opportunity to produce cheaper or better energy services.
  • In a majority of cases, the successful new energy source or technology provided the same service (i.e. heating, power, transport or light) with superior or additional characteristics (e.g. easier, cleaner or more flexible to use).
  • The existence of a niche market willing to pay more for these characteristics enabled the new energy source and technology to be refined gradually until they could compete with the incumbent energy source.
  • Nevertheless, this implied that, on average, the whole innovation chain took more than one hundred years and the diffusion phase nearly fifty years.
  • In the same way, since low-carbon energy sources and technologies are valued for their low climate impact, they will be able to develop gradually until they can compete with fossil fuels.
  • However, for a transition to take place, low carbon energy sources and technologies will have to provide cheaper energy services – possibly helped by carbon taxes or tradable permit approaches.
  • Based on past experiences, a complete transition to a low carbon economy is likely to be very slow.

How fast will our transition to renewables be?  Can business and government get behind a clear statement of the problem and develop a cogent unified transition plan?  Will the transition be proactive or reactive?

Shale Gas Exploration: The Coming Storm

When you see three mainstream media (Vanity Fair, HBO, and Bloomberg) covering the esoteric practice of hydraulic-fracturing (also know as “fracking”), pay attention. Vanity Fair’s report, A Colossal Fracking Mess; HBO’s report, Gasland; and Bloomberg’s report, Shale Game, all detail the nasty practice of fracking – a process used to release natural gas and oil from the earth.

How nasty is fracking? Watch this amazing video of a homeowner demonstrating one of the toxic side effects of Fracking taking place on land near this man’s home.

This video was posted a year ago, and has had about 130,000 views. Though it took a year for the story to hit the mainstream media – the cats out of the bag.

Burning water is just one of the side effects of fracking. Tests of fracking runoff show presence of benzene, ethylbenzene, toluene, boric acid, monoethanolamine, xylene, diesel-range organics, methanol, formaldehyde, hydrochloric acid, ammonium bisulfite, 2-butoxyethanol, and 5-chloro-2-methyl-4-isothiazotin-3-one. (Recently, in congressional testimony, drilling companies have confirmed the presence of many of these chemicals.) In the Vanity Fair article, Theo Colborn, a noted expert on water issues and endocrine disruptors, said that at least half of the chemicals known to be present in Fracking fluid are toxic; many of them are carcinogens, neurotoxins, endocrine disruptors, and mutagens.

HBO’s Gasland is a detailed journey around America, visiting the various communities where shale gas exploration is having an impact on health and wellbeing of the community. Special attention is given to the Marcellus Shale, which poses high risk to ground water for residents of Pennsylvania and New York.  All three reports detail this.

Each well needs 82 tons of assorted chemicals to get it producing. New York has banned shale gas drilling statewide until it adopts new rules. “We firmly believe, based on the best available science and current industry and technological practices, that drilling cannot be permitted in the city’s watershed,” Mayor Michael Bloomberg said in an April.

While the Vanity Fair and Bloomberg reports provide for gripping reading, Gasland’s use of video and narrative delivers a powerful compelling punch. After watching, I was thinking how grateful I was to not live in any of the numerous communities exposed to the toxic side effects of shale gas exploration.

Dimock Township in Pennsylvania is one of the towns that features in all three reports. The Bloomberg report says:

Victoria Switzer, who moved to Dimock Township, Pennsylvania, to build a $350,000 dream home with her husband, Jimmy, in 2004, had no idea how shale gas would consume her village of 1,400.

She says she found so much methane in her well that her water bubbled like Alka-Seltzer. Neighbor Norma Fiorentino says methane in her well blew an 8-inch-thick (20-centimeter-thick) concrete slab off the top. The $180 bonus Cabot paid to drill on Switzer’s 7.2 acres (2.9 hectares) and the $900 in royalties she gets each month don’t compensate, she says.

To paraphrase Ronald Reagan, “The 10 most terrifying words in the English language are ‘I’m from the oil company an I’m here to help.’

Transitioning from Fossil Fuels to Renewable Clean Energy

Gas/Oil production is peaking. The easy oil and gas has been consumed. What remains will increasingly be harder to get to and more complicated to extract. Witness the BP Deepwater Horizon debacle in the Gulf. The business of oil/gas extraction will get increasingly messy and rife with political and legal risk.

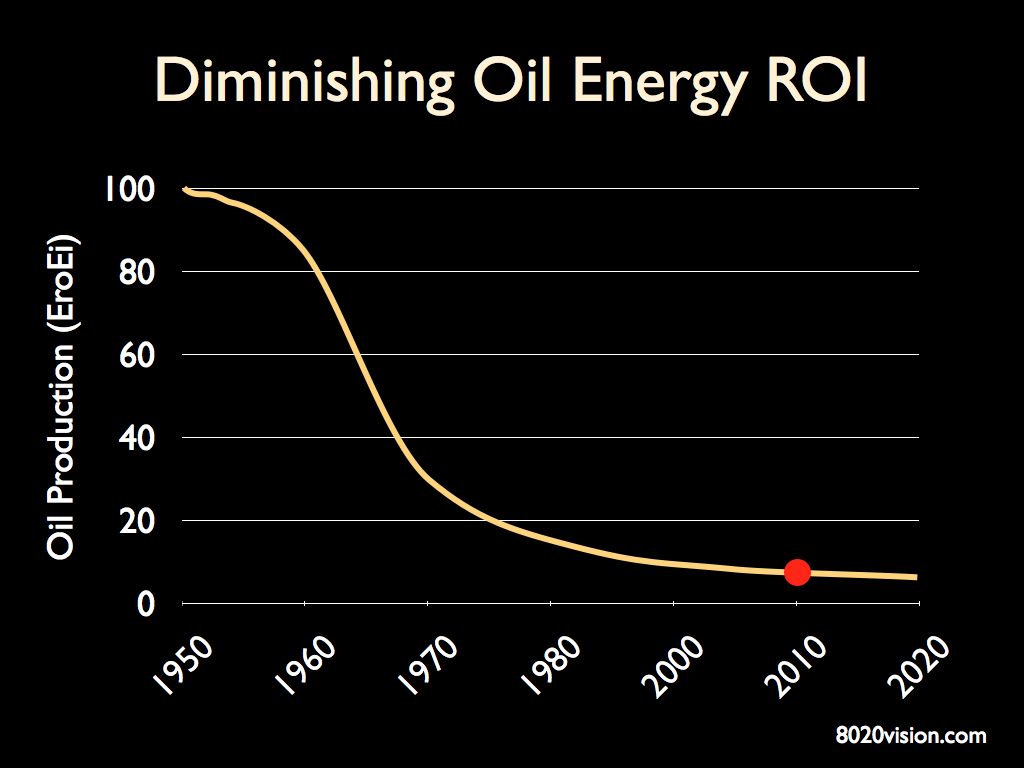
Oil ERoEI Trend

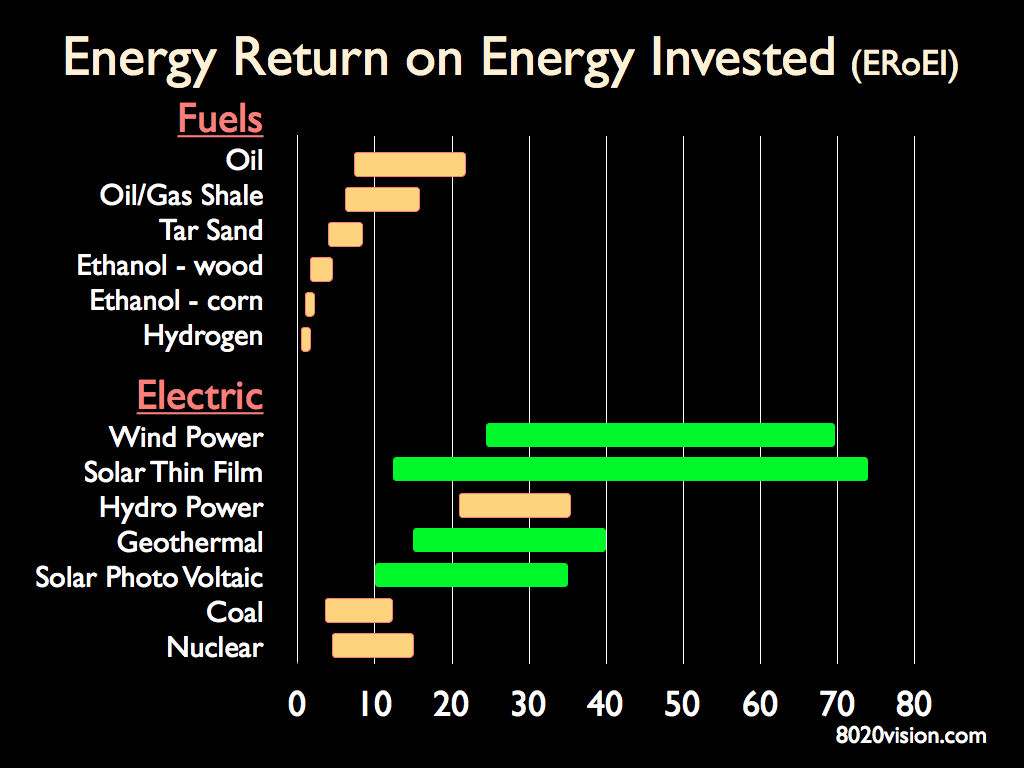
In 1950 we could produce 100 barrels of oil using the energy of 1 barrel of oil.  So the Energy Returned on Energy Invested (ERoEI) was about 100:1.  Today that ratio has fallen below 10:1. Similar low ERoEI can be found for other fossil fuels.  The chart below shows the ERoEI for various forms of energy.  The highest ROI is in wind and solar.  This is where we are seeing double-digit growth.

ERoEI

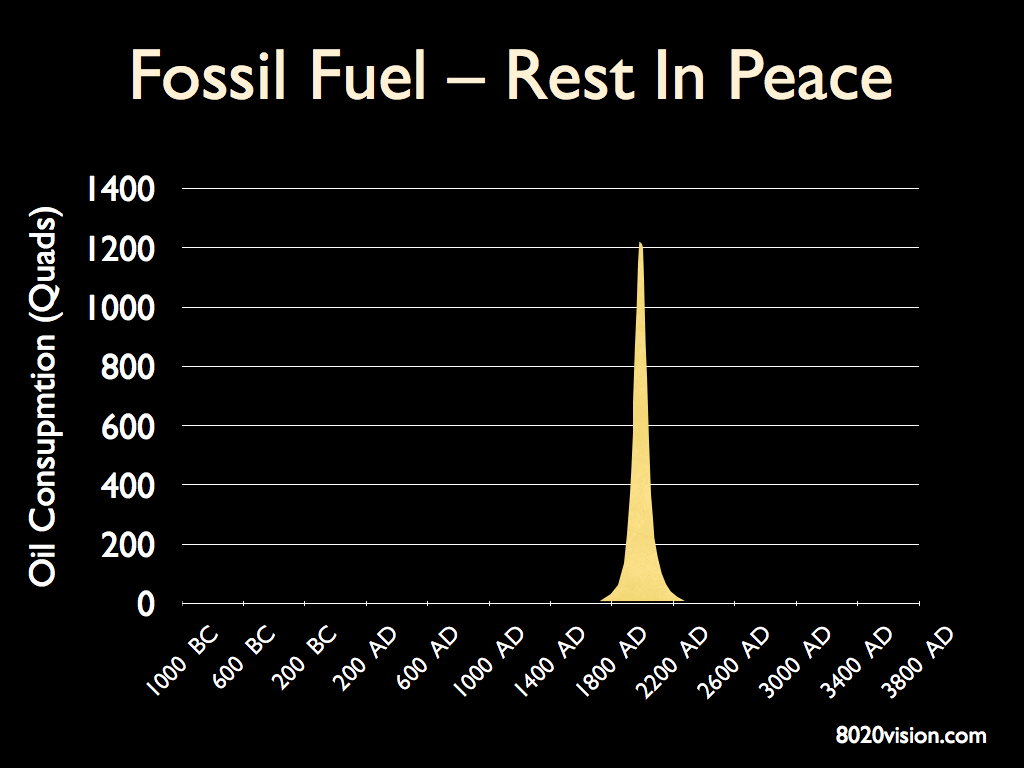
The oil/gas industry has 100 years of inertia propelling it forward. The golden days of fossil fuels are behind us. The industry is a dinosaur now – kept alive by our addiction to fossil fuels. Renewable energy is our future. The faster we can make the transition, the less damage will be done as the beast staggers to its rotten end.

Bryan Walsh, one of my favorite environmental reporters, just published this evenhanded video that looks at some specific examples of toxic fracking related events in Pennsylvania, the heart of east coast gas extraction. The devastating impact on homeowners and communities is tragic.

Fossil fuels – RIP.

Peak Oil


Recommended Reading

Congress Releases Report on Toxic Chemicals Used In Fracking by Jay Kimball


Walmart Partnering with Patagonia on Sustainable Business Practices

A recent article in Forbes describes how Patagonia, one of the early thought-leaders on sustainable business practices, and Walmart, are partnering to help Walmart move up the sustainable business learning curve fast. The article emphasizes the need for not just being sustainable inside the business, but up the supply chain as well.

Highlights of the Forbes article:

  • Patagonia is working with Walmart to develop a sustainability index for its products
  • This initiative is being driven by Walmart CEO, Lee Scott, working with Patagonia’s CEO, Yvon Chouinard.
  • Walmart CEO Lee Scott first articulated a sustainable vision for Walmart in 2005 saying Walmart “must operate in a world that is healthy.
  • Walmart is assessing things like how much water is consumed in the manufacturing process of a product, whether pesticides are used, impact on climate change, energy efficiency, etc.
  • Walmart wants to place a scorecard on its store goods that rate products on eco-friendliness and social impact.
  • Walmart is evaluating its suppliers and will give preference to those who best comply.
  • Patagonia has helped others, including Nike, Gap, REI, and North Face.
  • Nike has gone on to form GreenXchange, a consortium of ten companies (among them, Yahoo) that will trade eco-friendly intellectual property.

Most businesses I talk with want to do the right thing in terms of caring for the planet, but it rarely shows up in their mission statements or operational imperatives. However, if you ask any business person if their business depends on a healthy customer and a healthy supply chain, the answer is an obvious “Yes!”

Sustainable Business Interdependence

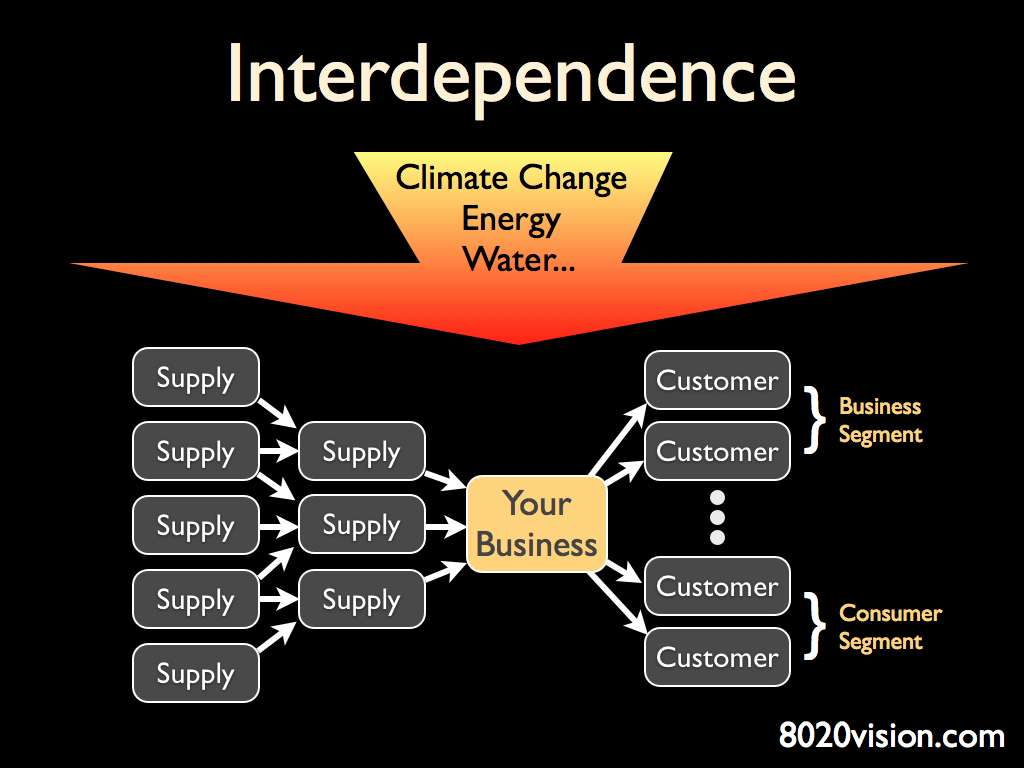
When I talk with business about strategies and tactics for sustainable business, we invariably come to this picture:

Business Interdependance

If a business confines their view of global issues to within their own business, they might think that climate change, water scarcity or high energy costs don’t impact them. They might say “Well, we don’t use much water, so that’s not an issue for us.” But if the view becomes more expansive to include the supply chain and the customer, they find increased risk to “business as usual.” Everyone interdepends on everyone else. Just as the proverbial rising tide lifts all boats, if the tide falls for one, it falls for all.

For example:

  • Water tables are falling rapidly in China. If a production plant in China, making product for Walmart, depends on water for the production, and the price of water suddenly rises, or access is limited by government edict, that impacts Walmart cost of goods and product flow.
  • If Walmart customers can’t afford to buy as much because they are spending too much on energy bills and gas expenses because the price of oil is at $120 a barrel, Walmart top line revenue growth declines.

Even if a business isn’t selling directly to “the consumer,” there is risk. If a company has businesses as a customer segment, they must understand how those businesses will be impacted. For example, if Walmart customers choose to spend less money at Walmart because of rising energy prices or fear of losing a job, Walmart will place less orders with their vendors and vendor order volume will fall. So consumer wellbeing matters to vendors all the way up the supply chain.

Walmart is the biggest retailer in the world. They are taking the long view and understand the interdependence of their success with the health of their supply chain and customer base.

Regarding sustainable practices, as a business expands its field of view to include supply chain and customer, there are three key things to examine:

  1. Mitigation – Understanding what impact global issues will have on the business and creating adaptive strategies and tactics to prepare. Shareholder value is protected.
  2. Innovation – As a business understands the global trends and challenges, they can innovate solutions that will have real value for their business, supply chain and customers, and beyond the, open new markets and opportunities. Shareholder value is increased.
  3. Advocacy – Are the steering directions a business gives to representative associations, lobbying firms, chambers of commerce and state and federal representatives in alignment with new found adaptive strategies and tactics?

Thinking like Walmart – What can a business do to ensure a healthy world?

Perhaps we should call it the The New Trickle Around Economy!

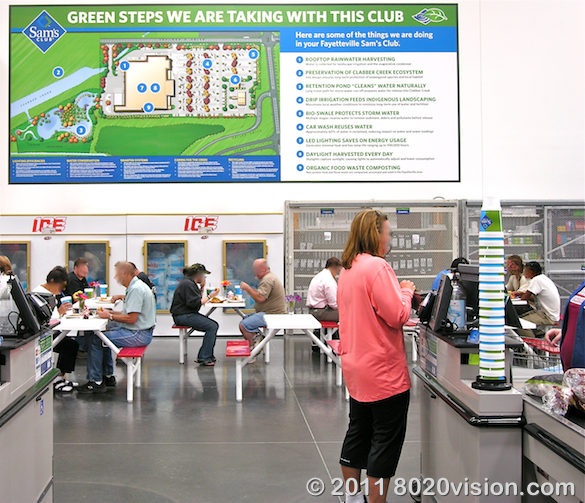
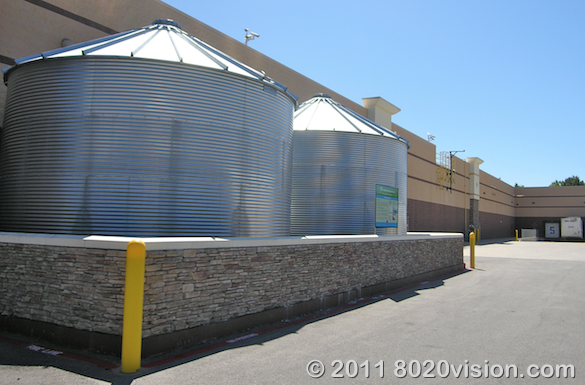
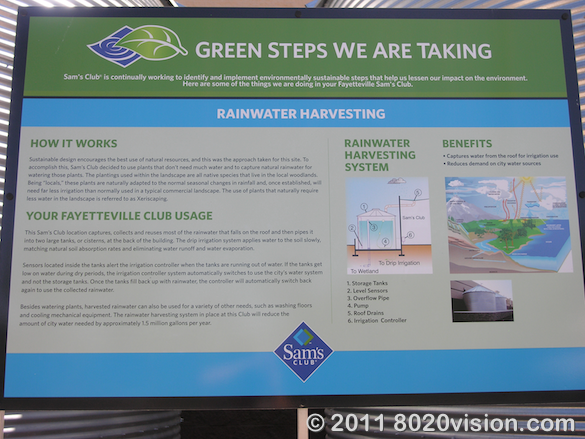
More on this in a future post. For now, here are some photos I took while visiting Walmart headquarters, in Bentonville, AK, for a book I am writing on sustainable business strategies. These pictures were taken while touring one of Walmart’s flagship stores in Fayetteville, AR.

Walmart store green steps program, sign at check out
Walmart store Green Steps program, sign at check out, in Fayetteville, AK
Walmart store green steps program, rain water harvesting catchment tanks at back of store
Walmart store green steps program, rain water harvesting description
Walmart store green steps program, wetlands for catching run-off
Walmart store green steps program, wetlands for catching run-off, and purifying it naturally.
Walmart store green steps program, streamlined truck to reduce fuel consumption

Water Scarcity in the US

When I talk with groups about water, here are some factoids that usually surprise:

  • By 2020, California will face a shortfall of fresh water as great as the amount that all of its cities and towns together are consuming today.
  • By 2025, 1.8 billion
 people will live in conditions of absolute 
water scarcity, and 65 percent of the worlds population will be water stressed.
  • To grow a ton of wheat uses 1,000 tons of water. The US is the largest exporter of wheat to the world. When we export a ton of our wheat, we are effectively including 1,000 tons of water in the bargain.
  • In the US, 21 percent of irrigation is achieved by pumping groundwater at rates that exceed the water supplies ability to recharge.
  • There are 66 golf courses in Palm Springs.  On average, they each consume over a million gallons of water per day.
  • Lake Meade (the source of 95% of water for Las Vegas) will be dry in the next 4 to 10 years (see picture below).

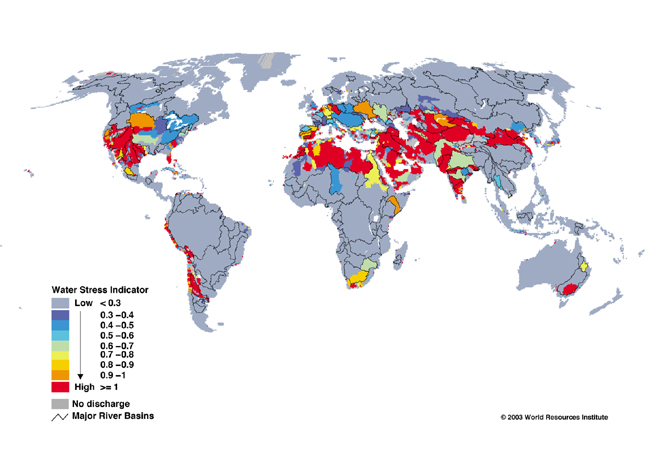
Water scarcity is a global problem and is not confined to “poor” nations.

Global Water Stress
Global Water Stress (scource: World Resources Institute)

In the US, we are now seeing headlines about droughts in places like Florida, Georgia, etc. – not your traditional areas of drought. A powerful way to understand the pervasiveness of America’s water scarcity problem is through the following pictures.

This first picture shows areas of the US that are experiencing moderate (yellow), severe (red), and extreme (purple) drought.

US Drought Map (source: NOAA)

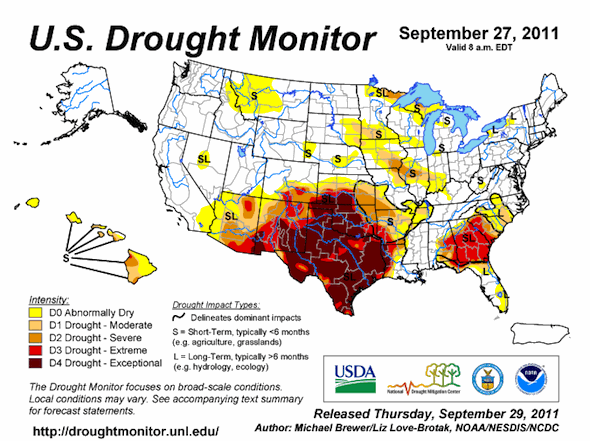
The picture above is constantly updated, and now, in fall 2011, Texas is experience unprecedented drought. I was driving through Texas a few weeks ago, and at that time, local radio stations talked about how Austin, as just one example, had experienced 72 days in a row of 100 plus temperatures. Here’s a picture of the current (September 27, 2011) drought situation throughout the US. Note that drought levels in most of Texas are at level D4 – “Exceptional.”

US drought map
US drought map - September 29, 2011 (source: NOA, NESDIS, NCDC)

These dry conditions have fostered endless fires that are sweeping across Texas and throughout the Southwest. Predictions are that the drought will likely last for years. Planners will need to make sure public policy on water conservation are in line with emerging water scarcity conditions. When does a drought become a desert?

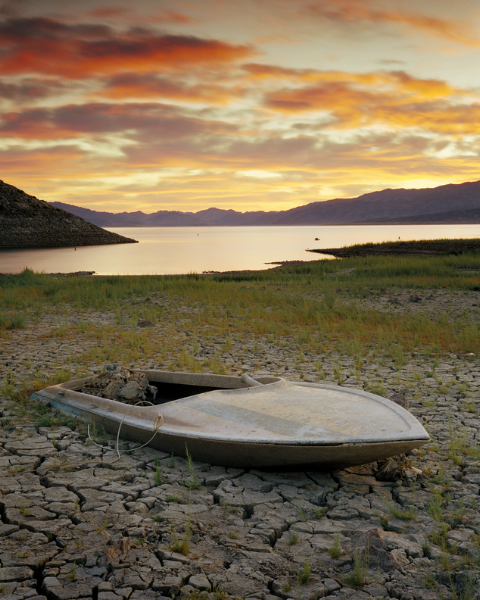
Shifting the lens toward the Southwest, here’s a picture of Lake Meade, boating haven and water source for Las Vegas. Current estimates predict it will be dry in the next 4 to 10 years.

Lake Meade water scarcity
A picture of the fast disappearing Lake Meade taken in 2007

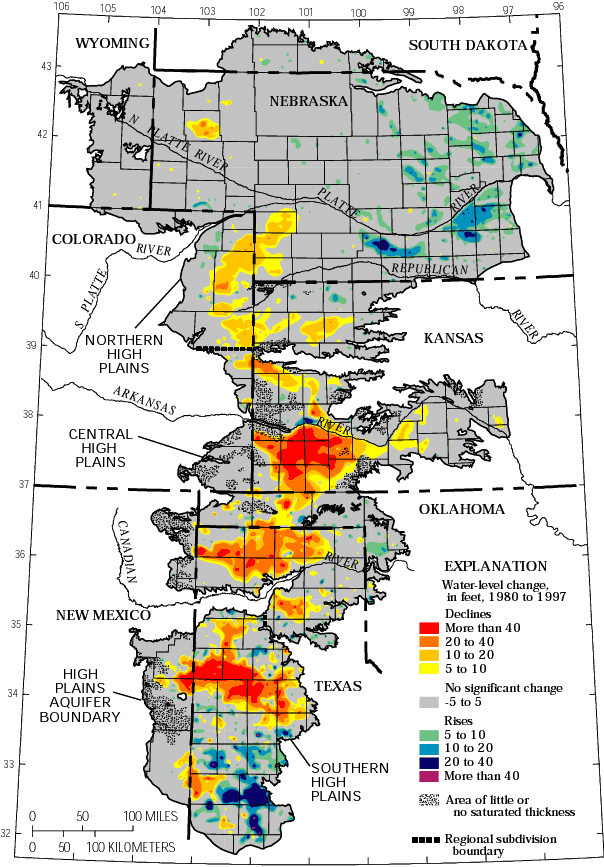
Food production in the “breadbasket” of the US depends on water from the Ogallala Aquifer.  The picture below shows where the sharpest declines in water level are occurring.

Ogallala Aquifer water shortage
Ogallala Aquifer (source: USGS)
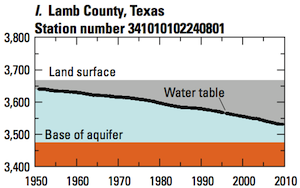
well-level changes in aquifer - Lamb County, Texas
(source: USGS)

The USGS monitors over 9,000 wells throughout the aquifer. Zeroing in on Texas again, here’s a picture of a typical well in Lamb County, Texas. Monitoring of this well started in about 1950, when irrigation began. This well shows a water table that has fallen steadily, and at current draw rates, this well will be dry in the next decade or so. How will farmers, who depend on a reliable source of water to grow crops and ride through accelerating drought, stay in business? How will the drying of the Ogallala Aquifer effect America’s ability to feed the nation?

A recent article in The Texas Tribune sets out the impact Ogallala water scarcity will have on Texas.  This story is not unique and is being played out throughout the 8 state region covered by the Ogallala.

Highlights of the Tribune article:

  • The Ogalala aquifer stretches across 8 states and accounts for 40 percent of water used in Texas.
  • The Ogallala’s volume will fall a staggering 52 percent between 2010 and 2060.
  • The use of big pivot irrigation — the lifeblood of the Panhandle — could be cut back severely in 10 to 20 years.
  • Texans are probably pumping the Ogallala at about six times the rate of recharge.
  • Water conservation and regulation policy is difficult to implement because Texas views groundwater as essentially a property right.
  • T. Boone Pickens business Mesa Water and other companies are buying up water rights, and looking to market water to cities like Dallas.  This is creating a variety of court challenges in the struggle to define the line between public and private water rights.

For more information on the critical issues around private and public access to water, read the well-researched Blue Gold by Maude Barlow and Tony Clarke.