In celebration of World Statistics Day, the US Energy Information Administration (EIA) has a short informative quiz on Energy. It is full of surprises. Check it out and see how you do.
Category: United States
Farming Wind Versus Farming Corn for Energy
keywords: wind power, wind turbines, corn ethanol, ERoEI
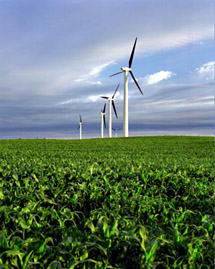
If a farmer has 1,000 acres of land, and he/she planted it with corn for making ethanol and erected wind turbines for generating electricity, how much energy will the farmer produce and what are the economics?
Wind Power
A typical wind farm will have about 15 wind turbines per 1,00o acres. Each wind turbine will generate about 500 kW of power (assuming 33% capacity factor). Electricity retails at about 12¢ per kW hour. So 1,000 acres will produce 15 x 500 x .12 = $900 of electricity per hour, which equates to about $8,000,000 per year, representing about 224 trillion BTUs of energy.
Corn Ethanol Power
A typical 1,000 acre corn farm will produce about 7,500 pounds of corn, yielding about 340,000 gallons of ethanol. Ethanol retails at about $1.80 per gallon. So 1,000 acres will produce 340,000 x 1.8 = $612,000 per year, representing about 26 billion BTUs of energy.
Energy Returned on Energy Invested
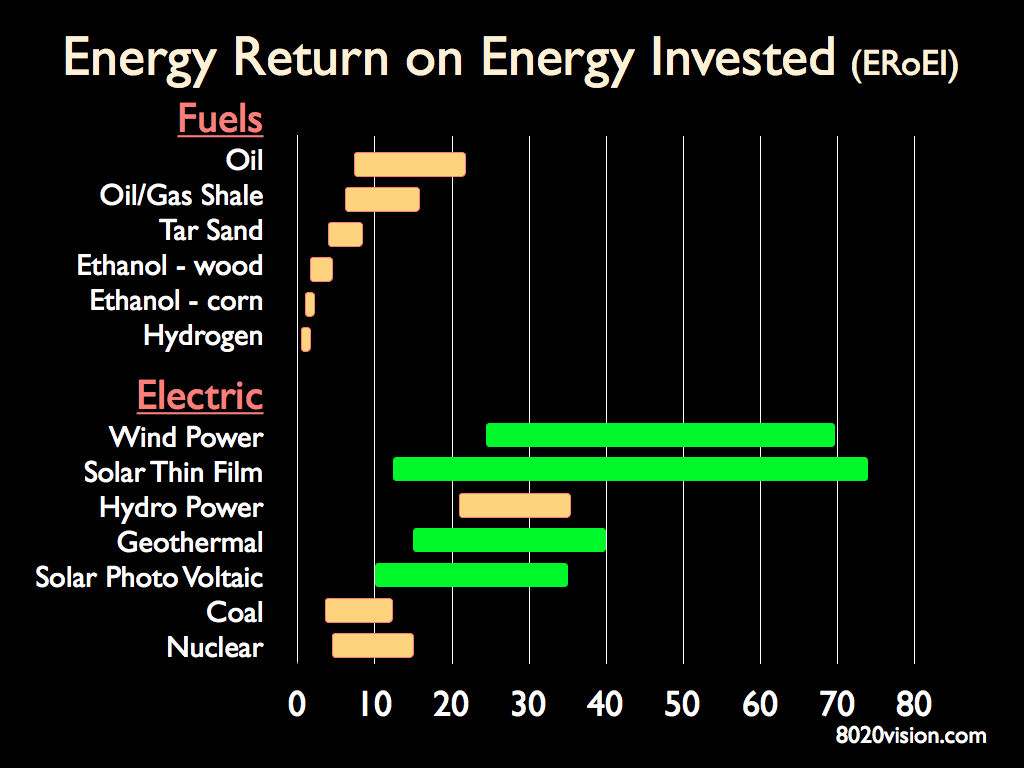
It takes energy to produce energy. The Energy Returned on Energy Invested (ERoEI) for wind turbines is an impressive, state of the art wind turbines are providing ERoEI of over 50:1.
It takes a lot of energy to produce corn ethanol, which yields a far lower ERoEI of between .8 and 1.65 (see Ethanol’s Energy Return on Investment: A Survey of the Literature 1990-Present by Roel Hammerschlag).
Side-effects of Wind Power and Corn Ethanol Production
Wind turbines are often perceived as an eyesore, marring the land with imposing manmade structures. Flying creatures such as hawks and bats are often killed as they pass through the turbine blades. Wind turbines are noisy, and are best located in rural areas, or at sea. Wind power needs to be located near power transmission resources, it that infrastructure will need to be built.
Corn ethanol yields just a bit more energy than it takes to produce it. It takes about 1,700 gallons of water to produce each gallon of corn ethanol. Corn used for ethanol production is corn not used for food production. As food corn supply is reduced, corn-based food prices rise.
Summary
Given 1,000 acres of land, planted with corn and a typical density of wind turbines, the table below summarizes the annual economic and energy value of corn ethanol fuel and wind turbine electricity.
| Wind Power | Corn Ethanol | |
| Retail Value | $8,000,000 | $612,000 |
| Energy Yield | 224 trillion BTUs | 26 billion BTUs |
| ERoEI | 50:1 | 1.5:1 |
Feebates
Keywords: Feebate, Art Rosenfeld, RMI, reducing automobile CO2 emissions, reducing oil addiction
Feebates offer a compelling approach to curbing automobile fuel consumption and CO2 emissions. The concept was pioneered in the 1970s by Jonathan Koomey and Art Rosenfeld (Lawrence Berkeley National Laboratory) and is finding renewed interest around the world.
Feebates are market-based policies for encouraging emissions reductions from new passenger vehicles by levying fees on relatively high-emitting vehicles, and using those collected fees to provide rebates to lower-emitting vehicles.
California is considering adopting a Feebate program. The UC Davis Institute of Transportation Studies recently published their analysis of a Feebate program – Potential Design, Implementation, and Benefits of a Feebate Program for New Passenger Vehicles in California. The report provides a detailed overview and analysis of Feebates and reviews Feebate programs already underway in other countries.
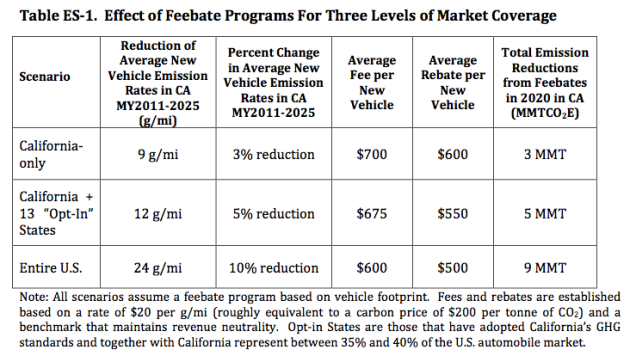
Rocky Mountain Institute has a good review of the Feebate approach to reducing oil consumption.
Highlights of RMI’s report Feebates: A Key to Breaking U.S. Oil Addiction
- The scale of U.S. oil consumption (nearly 19 million barrels per day) combined with its virtual monopoly of transportation energy (97 percent oil-based), creates strategic weakness, economic insecurity, widespread health hazards, and environmental degradation.
- Feebate is an innovative policy that greatly speeds the development and deployment of efficient vehicles.
- The California Legislature actually approved a similar “Drive+” law by an astonishing seven-to-one margin in 1980, but Governor George Deukmejian pocket-vetoed it after a mixed initial reaction from automakers, and it’s been bottled up ever since.
The basic idea of a feebate is simple. Buyers of inefficient vehicles are levied a surcharge (the “fee”), while buyers of efficient vehicles are awarded a rebate (the “bate”). By affecting the purchase cost up front, feebates speed the production and adoption of more efficient vehicles, saving oil, insecurity, cost, and carbon.
Though efficient vehicles’ reduced operating costs make them a good buy over the years, consumers’ implicit real discount rates, up to 60-plus percent per year (and nearly infinite for low-income car-buyers), make miles per gallon a relatively weak economic signal: long-term fuel savings are so heavily discounted that buyers, in effect, count just the first year or two—as minor an economic choice as whether to buy floor mats.
In contrast, feebates capture the life-cycle value of efficiency (or the cost of inefficiency) and reflect it in the sticker price. By increasing the price spread between less and more efficient vehicles, feebates bridge the gap between consumers’ and society’s perceptions of the time value of money. This corrects the biggest single obstacle to making and buying efficient vehicles.
Feebates can shift purchasing patterns in the short run and spur automakers’ innovation in the medium and long run. But to do both, a feebate program, like any well intentioned policy, must be properly designed and implemented. As RMI Principal Nathan Glasgow notes, “With feebates, the devil is really in the details.”
Feebate Forum
In 2007, RMI organized and hosted the first Feebate Forum, pulling together 27 experts from the auto and insurance industries, NGOs, academia, and government to discuss feebate design and implementation schemes. Through open dialogue, the group developed a set of design recommendations, barriers, and next steps for feebates.The participants agreed on the following design goals:
1. Metrics should be based on fuel efficiency or greenhouse gas emissions, and all types of transportation energy can be included—not just diverse fuels but also electricity.
2. The size of the fee or rebate shouldn’t depend on vehicle size. The feebate should reward buyers for choosing a more efficient model of the size they want, not for shifting size. A size-class-based feebate preserves the competitive position of each automaker regardless of its offerings, debunks the myth that consumers must choose between size and efficiency, and doesn’t restrict freedom of choice. Buyers can get the size they want; the efficiency of their choice within that size class determines whether they pay a fee or get a rebate, and how much.
3. Feebates should be implemented at the manufacturer level, so automakers, rather than a government agency, should pay the fees and collect the rebates. This lets manufacturers monitor results and adjust their vehicle mix accordingly, and it avoids any need for taxpayers to foot the bill for any costs. However, a good feebate program should be revenue-neutral, with “fees” paying for “bates” plus administrative costs—a potentially attractive feature. And since the “fees” are entirely avoidable by choice, they’re not a tax.
4. The “pivot point” between fees and rebates should be adjusted annually, so the program is trued up to stay revenue-neutral, and automakers have a predictable and continuous incentive to improve the efficiency of their offerings, spurring innovation.
5. Feebates should be designed for complete compatibility with efficiency or carbon-emissions standards, so automakers aren’t whipsawed between incompatible incentives or requirements. In practice, feebates may drive efficiency improvements much larger and faster than standards require, making the standards unimportant except to prevent recidivism.
France introduced the largest feebate program to date
- Averaging 133 grams of carbon dioxide per kilometer for the 2009 new light-vehicle fleet, France’s vehicles now have the lowest carbon emissions in the European Union.
- By comparison, the UK’s 2009 new vehicles emitted, and the EU average is, 146. Between 1995 and 2007 (when the French feebate was introduced at year-end), the emissions rate of new vehicles sold in France was falling at an average rate of 2.25 grams of carbon dioxide per kilometer per year. During the first two years of the feebate program, the annual emissions decrease more than tripled to 8 grams per kilometer. Overall, the efficient bonus vehicles’ market share nearly doubled, from 30 to 56 percent, while the inefficient malus vehicles’ share fell threefold, from 24 to 8 percent.
The French program was not size-neutral as RMI recommends for the U.S., and the data show it shifted new-car buyers toward smaller vehicles. The market share of the smallest (economy) cars grew from 44 percent in 2007 to 57 percent in 2009, much as we’d expect for such a fleetwide feebate structure: smaller vehicles tend to have higher efficiency and lower carbon emissions, so unless unusually inefficient, they’ll earn a rebate that’s attractive to many buyers. For the U.S., RMI recommends a size-neutral feebate design to shift the entire market toward lighter, more aerodynamic, and advanced-powertrain vehicles, not just smaller ones.
California is currently considering the introduction of a statewide feebate bill
- A state program would probably do more to shift the in-state vehicle sales mix than to spur innovative design, since even a market as big as California represents only a fraction of the U.S. auto market. Nonetheless, RMI is following this program closely.
- In 2008, California’s aggressiveness on fuel efficiency spurred higher national CAFE standards, and a number of other states follow California’s lead on Clean Air Act and related policies. States and regions can make fine laboratories for refining policy innovations that later guide uniform national policies.
Better, Cheaper, and Fairer Health Care
Keywords: healthcare, cost, life expectancy, t.r. reid, Japan, US
Washington Post reporter, documentary film correspondent and author T.R. Reid had a brief piece in Newsweek this week about Japan’s healthcare system. The article expands on an earlier interview Reid did on National Public Radio (NPR) – Japanese Pay Less for More Health Care – which you can listen to here.
To put Japan’s healthcare in perspective with the US and other countries, let’s look at healthcare performance data from the Organization for Economic Co-operation and Development (OECD). Using graphing approaches from National Geographic and Andrew Gelman we plot annual healthcare spending, life expectancy, and number of office visits per person, for a broad range of OECD countries. (NB: The area of the circle for each country is proportional to the number of doctor visits per person, e.g. Japan is 13.4 visits per year, US is 4 visits per year)

As can be seen, the US spends the most for healthcare, has middle of the road life expectancy, and few office visits. Japan has the highest life expectancy, three times as many office visits, at a third of the cost, compared to the US.
Commentary on the OECD data from National Geographic article The Cost of Care:
The United States spends more on medical care per person than any country, yet life expectancy is shorter than in most other developed nations and many developing ones. Lack of health insurance is a factor in life span and contributes to an estimated 45,000 deaths a year. Why the high cost? The U.S. has a fee-for-service system—paying medical providers piecemeal for appointments, surgery, and the like. That can lead to unneeded treatment that doesn’t reliably improve a patient’s health. Says Gerard Anderson, a professor at Johns Hopkins Bloomberg School of Public Health who studies health insurance worldwide, “More care does not necessarily mean better care.”
Highlights of T.R. Reids article – Japan shows how it’s done: keep quality up, costs down, and M.D.s on board
To gauge a health-care system’s success, it’s standard to consider three points: quality, coverage, and cost. On all three measures, Japan stands at or near the top in every comparative ranking.
Quality: The Japanese have the world’s longest life expectancy and the best recovery rates from just about every major disease. Infant mortality is less than half the U.S. rate. Japan usually leads the world in rankings of “avoidable mortality”—its effectiveness in curing diseases that can be cured.
Coverage: Japan’s health-insurance system covers everybody, including illegal aliens. It pays for physical, mental, dental, and long-term care. The Japanese are the world’s most prodigious consumers of medical care; on average they see the doctor about 15 times per year, three times the U.S. norm. They get twice as many prescriptions per capita and three times as many MRI scans. The average hospital stay is 20 nights—four times the U.S. average.
Cost: And yet Japan produces all that high-quality care at bargain-basement prices. The aging nation spends about $3,500 per person on health care each year; America burns through $7,400 per person and still leaves millions without coverage.
Japan has universal coverage, but it’s not “socialized medicine.” It’s largely a private-sector system. There is government insurance for the unemployed and the elderly, but most people rely on private plans. Japanese doctors are the most capitalist and competitive in the world. But we’re talking Japanese-style free enterprise here; there’s significant government regulation of the private players. Health insurers are required by law to cover everybody, and to pay every claim; the corollary is that everybody is required to buy health insurance. The price for a given treatment is identical everywhere in Japan. Officials say this is designed to attract doctors to rural communities, but that’s not working very well; many small towns on the outer islands have no doctor at all these days.
That fee schedule is the key to cost control in a country where people love going to the doctor. Basically, it shafts doctors and hospitals, paying some of the lowest fees on earth. As a result, doctors work long hours. They are comfortably middle-class, but not in the country-club set. But the savings can be huge in the high-tech realm that drives U.S. bills so high. An MRI scan of the neck region—routinely $1,400 or so in America—is $130 in Japan. Cost cutting like that has stimulated innovation and efficiency. Low fees are taking a toll, though. In a sense, Japanese medicine is the mirror opposite of America’s. We spend too much on health care, but still cover too few of our citizens; Japan provides lots of care to everybody, but probably spends too little to make its best-in-the-world system sustainable.
Reid’s bestselling book The Healing of America: A Global Quest for Better, Cheaper, and Fairer Health Care is available in paperback.
Growth Versus Consumerism
Keywords: growth, consumption, GDP, global economy, China, India, consumerism
Robert Reich wrote a thoughtful article on Why Growth is Good. Highlights of the article are below. In it, he differentiates between growth and consumption.
Growth is really about the capacity of a nation to produce everything that’s wanted and needed by its inhabitants. That includes better stewardship of the environment as well as improved public health and better schools.
A couple years ago I wrote an article – Nobel Laureate Joseph Stiglitz on Sustainability and Growth – in which Stiglitz talked about the idea that “we grow what we measure.” Here’s an exerpt from the end of that article that I think is relevant to Reich’s article:
For me, what Stiglitz is getting at is: We grow what we measure (GDP), and because we are measuring the wrong stuff, we are growing wrong. It seems to be in our DNA to want to “grow,” but like a garden, don’t we have a choice about what we grow? Are there ways we can grow our economy that restore abundance rather than consume it? What are the essential things to measure so that we are growing good things?
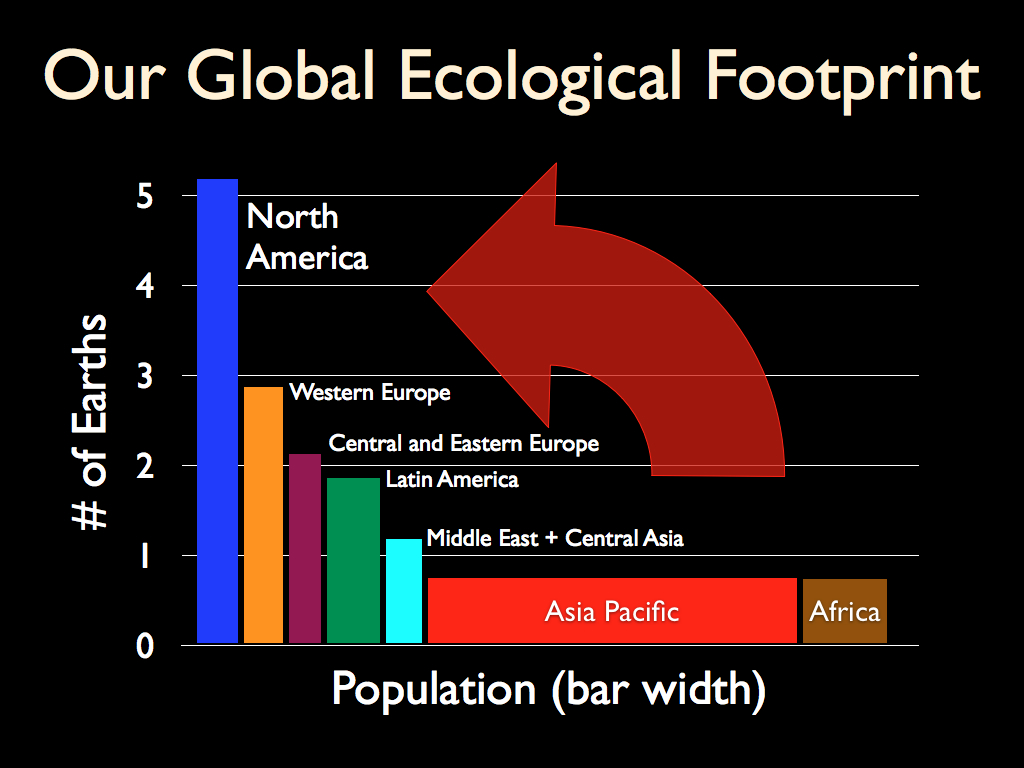
Using ecological footprint data from Global Footprint Network we can see the current state of consumption for North America and the rest of the world. American per capita consumption is legend. China and India are adopting their own versions of American-style consumerism. All nations are bumping up against the limits of the earth to provide what is needed for growth. We are collectively challenged to find new ways to grow, more lightly, in ways that restore rather than deplete.
N.B. The width of bar proportional to population in associated region. Ecological Footprint accounts estimate how many Earths were needed to meet the resource requirements of humanity for each year since 1961, when complete UN statistics became available. Resource demand (Ecological Footprint) for the world as a whole is the product of population times per capita consumption, and reflects both the level of consumption and the efficiency with which resources are turned into consumption products. Resource supply (biocapacity) varies each year with ecosystem management, agricultural practices (such as fertilizer use and irrigation), ecosystem degradation, and weather. This global assessment shows how the size of the human enterprise compared to the biosphere, and to what extent humanity is in ecological overshoot. Overshoot is possible in the short-term because humanity can liquidate its ecological capital rather than living off annual yields.
Highlights from Robert Reich’s Why Growth is Good
Economic growth is slowing in the United States. It’s also slowing in Japan, France, Britain, Italy, Spain, and Canada. It’s even slowing in China. And it’s likely to be slowing soon in Germany.
If governments keep hacking away at their budgets while consumers almost everywhere are becoming more cautious about spending, global demand will shrink to the point where a worldwide dip is inevitable.
You might ask yourself: So what? Why do we need more economic growth anyway? Aren’t we ruining the planet with all this growth — destroying forests, polluting oceans and rivers, and spewing carbon into the atmosphere at a rate that’s already causing climate chaos? Let’s just stop filling our homes with so much stuff.
The answer is economic growth isn’t just about more stuff. Growth is different from consumerism. Growth is really about the capacity of a nation to produce everything that’s wanted and needed by its inhabitants. That includes better stewardship of the environment as well as improved public health and better schools. (The Gross Domestic Product is a crude way of gauging this but it’s a guide. Nations with high and growing GDPs have more overall capacity; those with low or slowing GDPs have less.)
Poorer countries tend to be more polluted than richer ones because they don’t have the capacity both to keep their people fed and clothed and also to keep their land, air and water clean. Infant mortality is higher and life spans shorter because they don’t have enough to immunize against diseases, prevent them from spreading, and cure the sick.
In their quest for resources rich nations (and corporations) have too often devastated poor ones – destroying their forests, eroding their land, and fouling their water. This is intolerable, but it isn’t an indictment of growth itself. Growth doesn’t depend on plunder. Rich nations have the capacity to extract resources responsibly. That they don’t is a measure of their irresponsibility and the weakness of international law.
How a nation chooses to use its productive capacity – how it defines its needs and wants — is a different matter. As China becomes a richer nation it can devote more of its capacity to its environment and to its own consumers, for example.
The United States has the largest capacity in the world. But relative to other rich nations it chooses to devote a larger proportion of that capacity to consumer goods, health care, and the military. And it uses comparatively less to support people who are unemployed or destitute, pay for non-carbon fuels, keep people healthy, and provide aid to the rest of the world. Slower growth will mean even more competition among these goals.
Faster growth greases the way toward more equal opportunity and a wider distribution of gains. The wealthy more easily accept a smaller share of the gains because they can still come out ahead of where they were before. Simultaneously, the middle class more willingly pays taxes to support public improvements like a cleaner environment and stronger safety nets. It’s a virtuous cycle. We had one during the Great Prosperity the lasted from 1947 to the early 1970s.
Slower growth has the reverse effect. Because economic gains are small, the wealthy fight harder to maintain their share. The middle class, already burdened by high unemployment and flat or dropping wages, fights ever more furiously against any additional burdens, including tax increases to support public improvements. The poor are left worse off than before. It’s a vicious cycle. We’ve been in one most of the last thirty years.
No one should celebrate slow growth. If we’re entering into a period of even slower growth, the consequences could be worse.
For some excellent reading on this subject, check out the Recommended Reading section on Sustainable Business, Government, and Community. I especially found useful Lester Brown’s Plan B 4.0 and Jeffrey Sachs’ Common Wealth.
Using Water Heaters to Store Excess Wind Energy
Keywords: energy management, energy storage, smart grid, wind energy, renewable energy
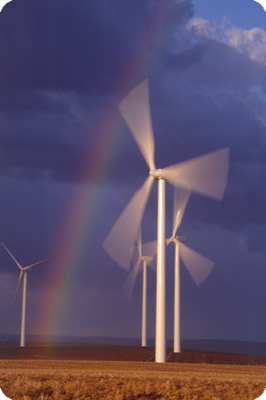 The Bonneville Power Administration (BPA) is recruiting one hundred homeowners in Washington for an experiment on how to store surplus wind energy. The BPA is testing a promising smart-grid concept that would use residential water heaters to help manage the fluctuations of wind energy generation.
The project will address two problems experienced on the grid: shortage of power during peak times and surges of power during windy periods, when the energy isn’t needed.
The BPA, working with Mason County Public Utility District Number 3, will install special devices on water heaters that will communicate with the electrical grid and tell the water heaters to turn on or off, based on grid conditions and the amount of renewable energy that’s available.
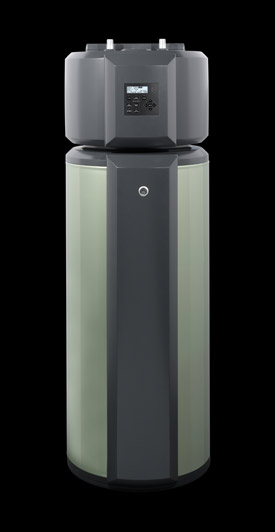 While homeowners will be able to override the control device at any time, it’s unlikely that they would even notice a change in temperature.
The water heaters in effect become energy storage devices — turning on to absorb excess power and shutting down when demand ramps up —leveling out the peaks and valleys of energy use. Benefits include:
- no need for expensive and toxic battery storage
- no need for fossil fuel burning power plants to fill in low wind energy gaps
- water heaters provide distributed storage, avoiding point loads on grid
- smart water heaters can be manufactured economically, for just a few dollars more.
Wind power is the fastest growing source of renewable energy, accounting for about 3 percent of US electric generation. About 53 million homes in the United States, or 42 percent of the total, use electric hot water heaters. Added up, they account for 13 percent to 17 percent of nationwide residential electricity use.
In the Pacific Northwest, home of the BPA, it’s estimated that there are 4.3 million water heaters that can store 2,600 megawatt-hours by allowing the storage temperature to vary by five degrees. (NB: For a detailed analysis see the Northwest Power and Conservation Council report prepared by Ken Corum.)
The Northwest Energy Coalition does a nice job detailing the background, and benefits of this approach to storing excess wind energy. Highlights of their article, Using simple smart water heaters to integrate intermittent renewables, are below.
Highlights of Using simple smart water heaters to integrate intermittent renewables
Background
Wind-generated power is clean, relatively cheap and available in large quantities. But the wind itself is quite unpredictable, so much so that for each average megawatt (aMW) of wind power we need, we must erect about 3 megawatts of turbine capacity, since actual output could be anywhere from 0 to 3 megawatts at any instant.
Suppose our region, which consumes about 21,000 average MW of electricity each year, wants to get a third of its power from wind. We’d have to build about 21,000 megawatts (MW) of turbine capacity to get 7,000 average MW of electricity. Given weather variability and the geographical spacing of wind projects, over time the actual production of those 21,000 megawatts of turbines will vary from about 1,000 MW to 15,000 MW due to weather fronts and daily warming patterns. Problematic 3,000- to 4,000-megawatt swings can occur in as little as 10-30 minutes.
To deal with large variations in wind, grid operators use some expensive tools now at their disposal, generally limited to ramping natural gas-fired combustion turbines and/or hydro generation up and down. Ramping up is fairly easy; today’s grid has ample reserve capacity on which to draw.
Ramping down is another matter. When wind generation suddenly spikes during periods of low demand (at night or during mild weather hours), the system can have less flexible generation on-line (nuclear and coal plants) that cannot be cut back to make room for the wind. The region’s inflexible “baseload” coal plants and one nuclear plant, which together provide more than a quarter of our electricity, cannot be economically ramped up and down in response to wind variability.
Previous Transformers and NW Energy Coalition’s Bright Future report have addressed wind-integration issues, noting – in particular – that the problems will lessen as we progressively eliminate coal-fueled power from the Northwest grid, as renewable projects grow and become more diverse and geographical dispersed, and as “smart grid” deployment provides a new back-up resource.
Smart grid to the rescue
In a Feb. 10, 2009, presentation to the Northwest Power and Conservation Council, Council staff member Ken Corum provided a powerful example of how one relatively simple smart grid innovation – using electric water heaters as temporary storage devices — could help the grid integrate large amounts of wind power at very low cost. We expand on Corum’s example below.
The Northwest power system serves about 4.3 million electric water heaters. If all were running at once, their loads would total more than 19,000 MW. Of course, they don’t all run at the same time. Actual demand might be just a few hundred megawatts in the middle of the night, surging to more than 5,000 MW around 8 a.m. when people take their showers. Use drops during the day, and then peaks again at about 3,500 MW around 8 p.m. as people come home and wash dishes, clothes, etc.
Now imagine that as part of the smart grid, each water heater contains a chip that can receive signals from grid operators to raise or lower the water temperature by a few degrees. As wind generation picks up, the grid operator slightly raises the temperature set points on millions of water heater thermostats, thus “storing” the wind power for later use. Should the wind suddenly drop, the operator lowers the temperature points, causing many water heater elements to click off for a time.
Most people won’t even notice the small temperature changes. But spread over millions of water heaters, those few degrees of difference are enough to avoid ramping fossil-fuel and hydro generation up and down, thus improving system-wide fuel efficiency and leaving more water in the river for migrating salmon.
Once the infrastructure — smart meters that can communicate with both the utility and home appliances — is in place, manufacturers could start installing computer chips, adding perhaps $5-10 to the cost of a water heater, Given the system savings the water heater controls would generate, utilities could afford to cover the additional cost, and/or offer customers a rate discount or other incentive in exchange for limited control of their water heaters.
Currently, for example, Idaho Power pays residential customers $7 per month to participate in its A/C Cool Credit Program, which slightly backs down air conditioning power during peak demand periods.
Water heaters are a great choice for smart grid applications because of their relatively short life spans. Over about 12 years, the current stock could be totally replaced with smart water heaters.
Shifting peaks – and keeping the lights on
Aside from facilitating the integration of thousands of megawatts of wind power, controllable water heaters (and other appliances and equipment that draw electricity 24/7) provide two other benefits:
1. Reliability. Major power lines and generating plants occasionally suffer sudden outages due to fires, ice, wind or equipment failure. Turning down a few million water heaters could quickly shave demand enough to cover the power loss and avoid a major blackout. In fact, the chips discussed above can be made to automatically and instantaneously detect frequency changes in the electricity they use without any operator intervention. The chip reacts to a sudden change from the standard 60 cycles per second by instantly turning the heater on or off to keep the grid stable.
2. Money. Utilities spend a lot of money following the daily peaks and valleys of human activity. Thirty to 40% of their generation capacity sits idle for much of each 24-hour day. Another 5-10% come on only during very extreme weather — the hottest or coldest days. But utilities must cover the capital and maintenance costs of all these resources, no matter how little used.
Controllable water heaters would rarely go on during system peaks and could help utilities respond to system emergencies … at huge cost savings. Utilities would be able to spread demand more evenly throughout the day, increasing power line and substation efficiency and avoiding the costs of some mostly idle generation resources. These actions could lower bills substantially and/or provide savings to fund additional smart grid investment.
And that’s just one example
Though this article has focused on electric water heaters, similar controls can be installed in freezers, air conditioners and electric furnaces. Electric and hybrid-electric vehicles are other examples. Their charging rates can be altered while the vehicles are plugged into the grid. The opportunities are only starting to reveal themselves.
Allowing grid operators access to our appliance controls raises issues of cybersecurity, privacy and the potential for short-circuiting due process (e.g., automatic shutoff for non-payment of bills). Those issues must be adequately addressed. But the smart grid can help move the Northwest quickly and affordably to a bright energy future.

