NOAA: June, April to June, and Year-to-Date Global Temperatures are Warmest on Record

Climate change news from the National Oceanic and Atmospheric Administration (NOAA):

15 July 2010

Last month’s combined global land and ocean surface temperature made it the warmest June on record and the warmest on record averaged for any April-June and January-June periods, according to NOAA. Worldwide average land surface temperature was the warmest on record for June and the April-June period, and the second warmest on record for the year-to-date (January-June) period, behind 2007.

The monthly analysis from NOAA’s National Climatic Data Center, which is based on records going back to 1880, is part of the suite of climate services NOAA provides government, business and community leaders so they can make informed decisions.

Scientists, researchers and leaders in government and industry use NOAA’s monthly reports to help track trends and other changes in the world’s climate. This climate service has a wide range of practical uses, from helping farmers know what and when to plant, to guiding resource managers with critical decisions about water, energy and other vital assets.
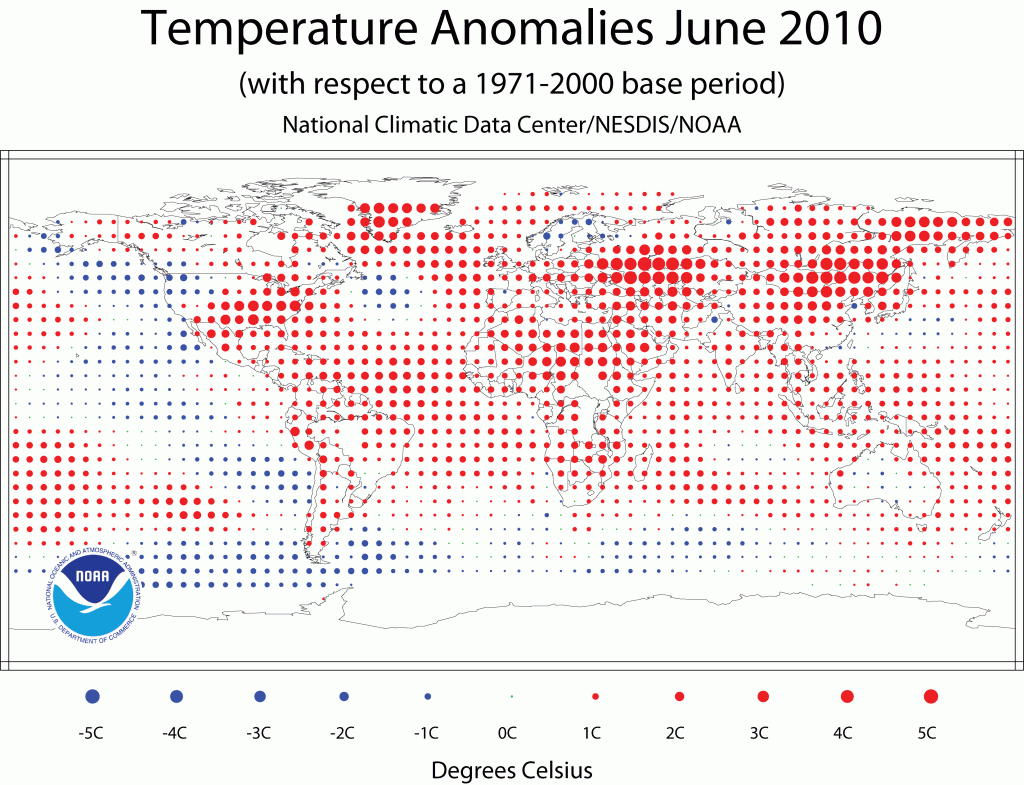
NOAA Temperature Anomalies June 2010
(source: NOAA National Climatic Data Center)

The Guardian did a nice job of going deeper into the story. Here are highlights from their article:

  • The figures released last night by the National Oceanic and Atmospheric Administration (NOAA) suggest that 2010 is now on course to be the warmest year since records began in 1880.
  • Scientists expressed surprise that the June land surface temperature exceeded the previous record by 0.11C (0.20F). “This large difference over land contributed strongly to the overall global land and ocean temperature anomaly,” said John Leslie, a spokesman for NOAA.
  • Separate satellite data from the US National Snow and Ice Data Centre in Colorado shows that the extent of sea ice in the Arctic was at its lowest for any June since satellite records started in 1979.
  • In a further possible sign of a warming world, the Jakobshavn Isbrae glacier, one of the largest in Greenland, lost a 2.7-square mile chunk of ice and retreated one mile between 6-7 July – one of the largest single losses to a glacier ever recorded.
  • The glacier, a tongue of the Greenland ice sheet, has retreated six miles since 2000 and more than 27 miles since 1850. It is believed to be the single largest contributor to sea level rise in the northern hemisphere.
  • Greenland’s ice sheet, a vast body of ancient ice covering 1.7 million sq km, is melting today more rapidly than only a few decades ago. Since 2000, the ice sheet is calculated to have lost about 1,500 cubic kilometres of water– enough to raise global sea levels by 5mm . If the entire ice sheet melted, the world’s oceans would rise by over 23 feet.
  • Glaciologists expressed surprise at the speed of the break-up of the glacier: “This is unusual because it occurs on the heels of a warm winter that saw no sea ice form in the surrounding bay … it lends credence to the theory that warming of the oceans is responsible for the ice loss observed throughout Greenland and Antarctica,” said NASA scientist Thomas Wagner.

Present concentration of carbon dioxide gas in the atmosphere is 31 per cent above pre-industrial levels.

Referring to the chart below, current emissions are tracking above the most intense fossil fuel emission scenario established by the IPCC Special Report on Emissions Scenarios-SRES (2000).
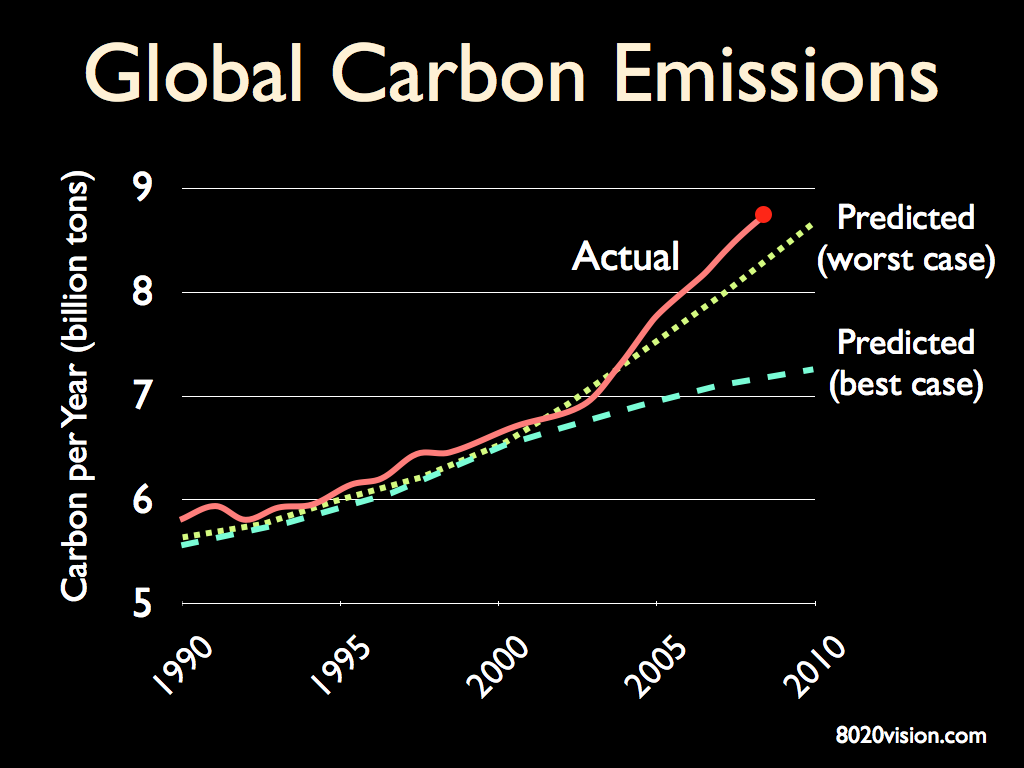
Global Carbon Emissions 2010
(source: EIA, CDIAC, Raupach et al. 2007, Proceedings of National Academy of Sciences)

Referring to the chart below, NOAA has modeled change in seasonal mean surface air temperature from the late 20th century (1971-2000 average) to the middle 21st century (2051-2060). The left panel shows changes for June July August (JJA) seasonal averages, and the right panel shows changes for December January February (DJF). The simulated surface air temperature changes are in response to increasing greenhouse gases and aerosols based on a “middle of the road” estimate of future emissions. As we can see from the chart above, we are exceeding “middle of the road” substantially.
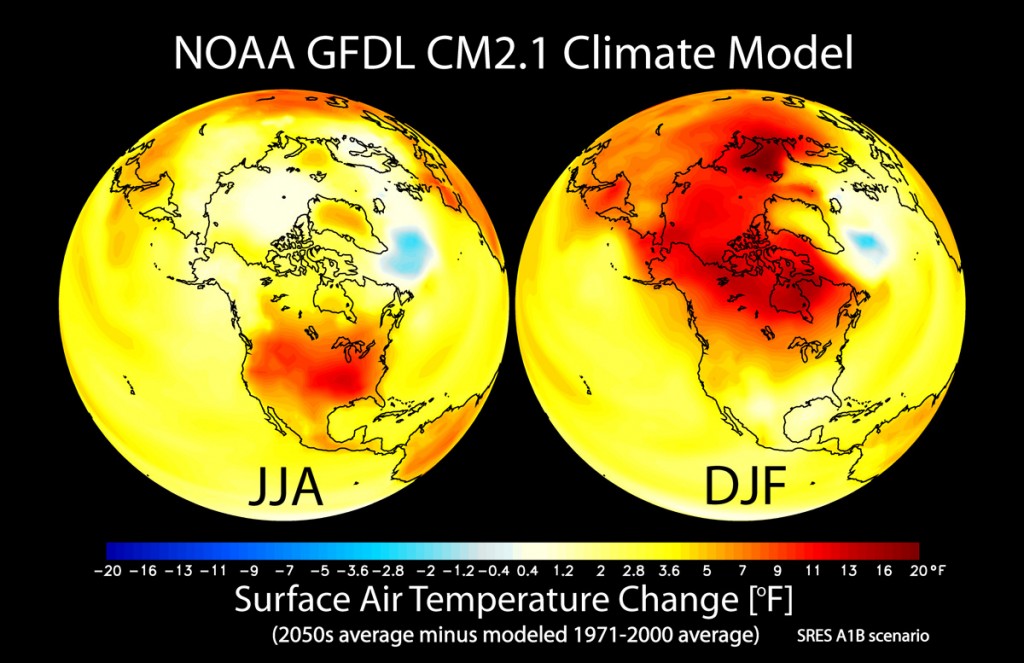
surface air temps change 2050
(source: NOAA - National Oceanic and Atmospheric Administration)

Red areas on the map represent a 20 degree increase from averages in the late 20th century. This has major implications for food production, water, and energy, not to mention business as usual.

For a hint of what to expect, look at the infamous 2003 heat wave that struck Europe for just 7 days:

  • 30,000 heat-related deaths, 14,802 in Fance alone.
  • Extensive forest fires (10% of Portugal forests burned).
  • Temperatures ranged from 104 ºF to 118 ºF (40 ºC to 48 ºC).
  • Melting glaciers in the Alps caused avalanches and flash floods in Switzerland.
  • Extensive crop loss of wheat across Europe (13% to 80%).

Here’s a picture of the temperature anomaly across Europe during the heat wave. (N.B. Red indicates +10 ºC, +18ºF anomaly)
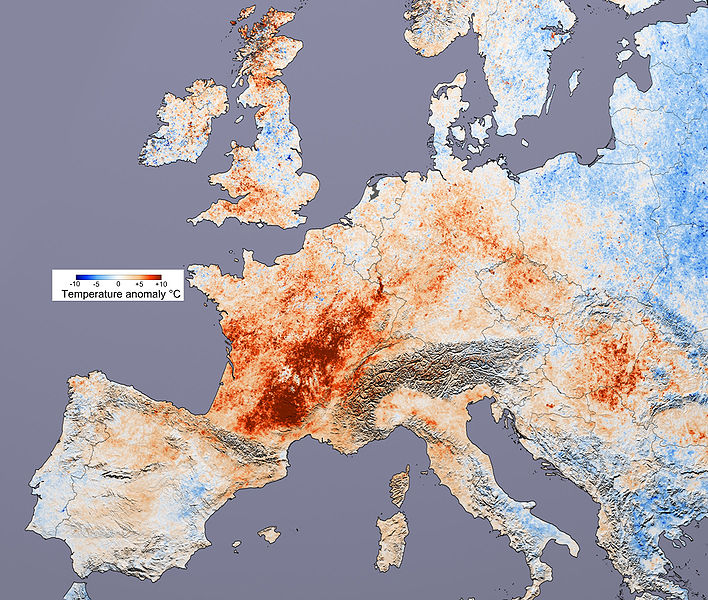
2003 European heat wave
(source: NASA)

For related articles and books, see:

Climate Change May Reduce Protein in Crops
Recommended Reading

Shale Gas Exploration: The Coming Storm

When you see three mainstream media (Vanity Fair, HBO, and Bloomberg) covering the esoteric practice of hydraulic-fracturing (also know as “fracking”), pay attention. Vanity Fair’s report, A Colossal Fracking Mess; HBO’s report, Gasland; and Bloomberg’s report, Shale Game, all detail the nasty practice of fracking – a process used to release natural gas and oil from the earth.

How nasty is fracking? Watch this amazing video of a homeowner demonstrating one of the toxic side effects of Fracking taking place on land near this man’s home.

This video was posted a year ago, and has had about 130,000 views. Though it took a year for the story to hit the mainstream media – the cats out of the bag.

Burning water is just one of the side effects of fracking. Tests of fracking runoff show presence of benzene, ethylbenzene, toluene, boric acid, monoethanolamine, xylene, diesel-range organics, methanol, formaldehyde, hydrochloric acid, ammonium bisulfite, 2-butoxyethanol, and 5-chloro-2-methyl-4-isothiazotin-3-one. (Recently, in congressional testimony, drilling companies have confirmed the presence of many of these chemicals.) In the Vanity Fair article, Theo Colborn, a noted expert on water issues and endocrine disruptors, said that at least half of the chemicals known to be present in Fracking fluid are toxic; many of them are carcinogens, neurotoxins, endocrine disruptors, and mutagens.

HBO’s Gasland is a detailed journey around America, visiting the various communities where shale gas exploration is having an impact on health and wellbeing of the community. Special attention is given to the Marcellus Shale, which poses high risk to ground water for residents of Pennsylvania and New York.  All three reports detail this.

Each well needs 82 tons of assorted chemicals to get it producing. New York has banned shale gas drilling statewide until it adopts new rules. “We firmly believe, based on the best available science and current industry and technological practices, that drilling cannot be permitted in the city’s watershed,” Mayor Michael Bloomberg said in an April.

While the Vanity Fair and Bloomberg reports provide for gripping reading, Gasland’s use of video and narrative delivers a powerful compelling punch. After watching, I was thinking how grateful I was to not live in any of the numerous communities exposed to the toxic side effects of shale gas exploration.

Dimock Township in Pennsylvania is one of the towns that features in all three reports. The Bloomberg report says:

Victoria Switzer, who moved to Dimock Township, Pennsylvania, to build a $350,000 dream home with her husband, Jimmy, in 2004, had no idea how shale gas would consume her village of 1,400.

She says she found so much methane in her well that her water bubbled like Alka-Seltzer. Neighbor Norma Fiorentino says methane in her well blew an 8-inch-thick (20-centimeter-thick) concrete slab off the top. The $180 bonus Cabot paid to drill on Switzer’s 7.2 acres (2.9 hectares) and the $900 in royalties she gets each month don’t compensate, she says.

To paraphrase Ronald Reagan, “The 10 most terrifying words in the English language are ‘I’m from the oil company an I’m here to help.’

Transitioning from Fossil Fuels to Renewable Clean Energy

Gas/Oil production is peaking. The easy oil and gas has been consumed. What remains will increasingly be harder to get to and more complicated to extract. Witness the BP Deepwater Horizon debacle in the Gulf. The business of oil/gas extraction will get increasingly messy and rife with political and legal risk.

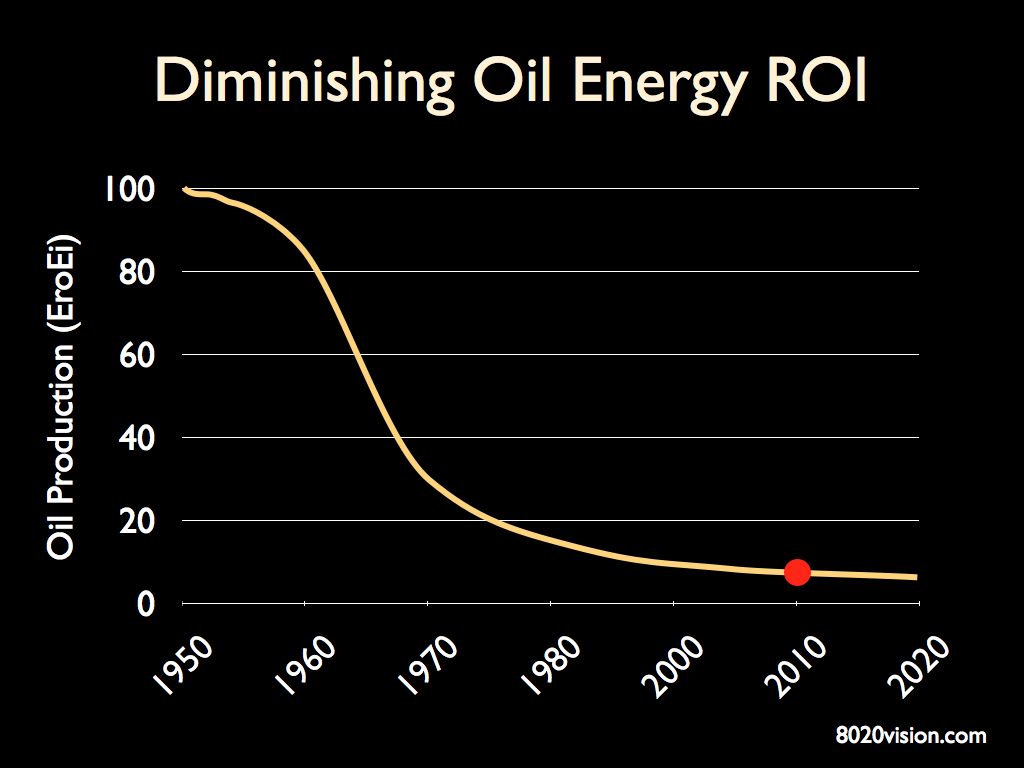
Oil ERoEI Trend

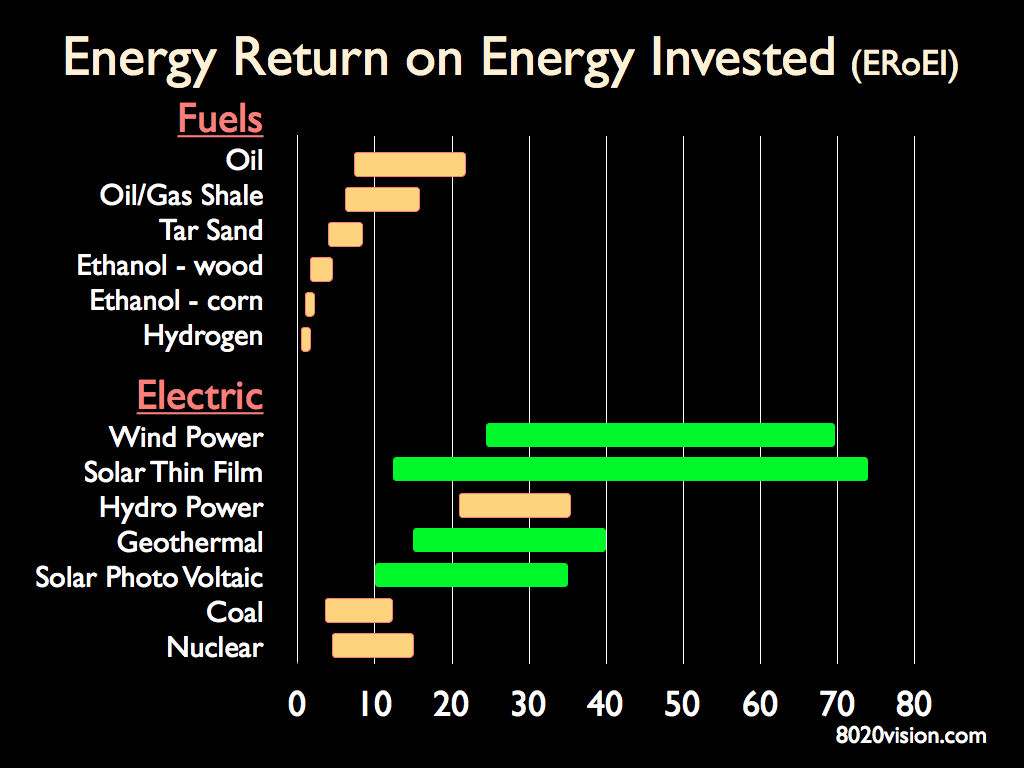
In 1950 we could produce 100 barrels of oil using the energy of 1 barrel of oil.  So the Energy Returned on Energy Invested (ERoEI) was about 100:1.  Today that ratio has fallen below 10:1. Similar low ERoEI can be found for other fossil fuels.  The chart below shows the ERoEI for various forms of energy.  The highest ROI is in wind and solar.  This is where we are seeing double-digit growth.

ERoEI

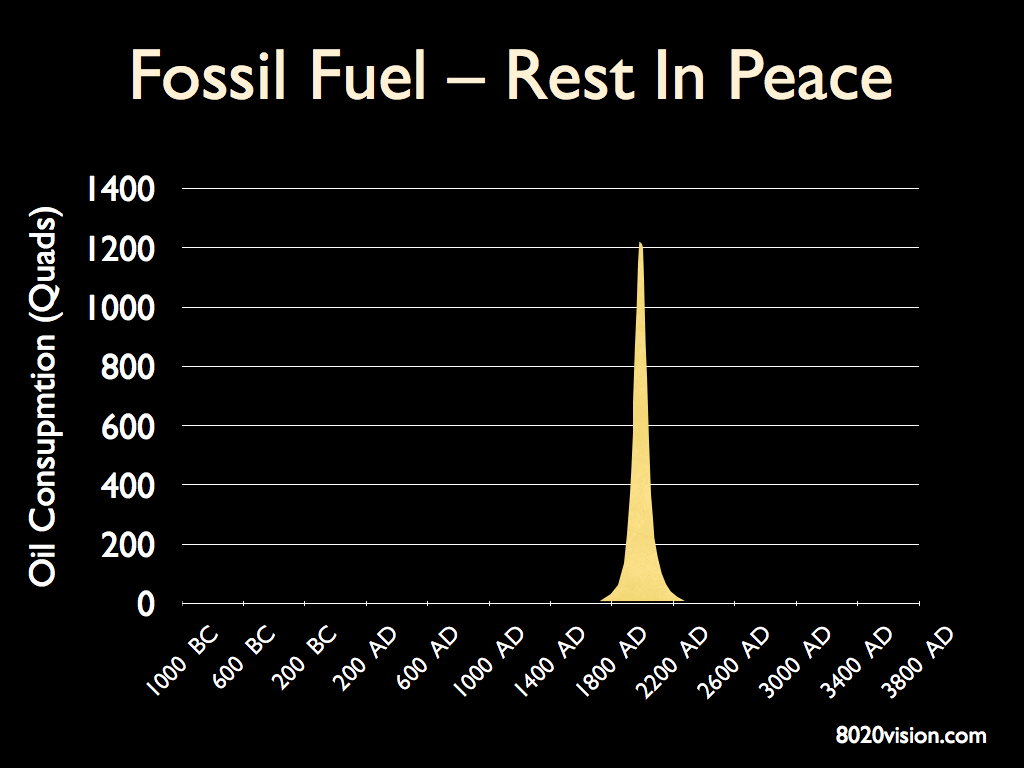
The oil/gas industry has 100 years of inertia propelling it forward. The golden days of fossil fuels are behind us. The industry is a dinosaur now – kept alive by our addiction to fossil fuels. Renewable energy is our future. The faster we can make the transition, the less damage will be done as the beast staggers to its rotten end.

Bryan Walsh, one of my favorite environmental reporters, just published this evenhanded video that looks at some specific examples of toxic fracking related events in Pennsylvania, the heart of east coast gas extraction. The devastating impact on homeowners and communities is tragic.

Fossil fuels – RIP.

Peak Oil


Recommended Reading

Congress Releases Report on Toxic Chemicals Used In Fracking by Jay Kimball


Water Scarcity in the US

When I talk with groups about water, here are some factoids that usually surprise:

  • By 2020, California will face a shortfall of fresh water as great as the amount that all of its cities and towns together are consuming today.
  • By 2025, 1.8 billion
 people will live in conditions of absolute 
water scarcity, and 65 percent of the worlds population will be water stressed.
  • To grow a ton of wheat uses 1,000 tons of water. The US is the largest exporter of wheat to the world. When we export a ton of our wheat, we are effectively including 1,000 tons of water in the bargain.
  • In the US, 21 percent of irrigation is achieved by pumping groundwater at rates that exceed the water supplies ability to recharge.
  • There are 66 golf courses in Palm Springs.  On average, they each consume over a million gallons of water per day.
  • Lake Meade (the source of 95% of water for Las Vegas) will be dry in the next 4 to 10 years (see picture below).

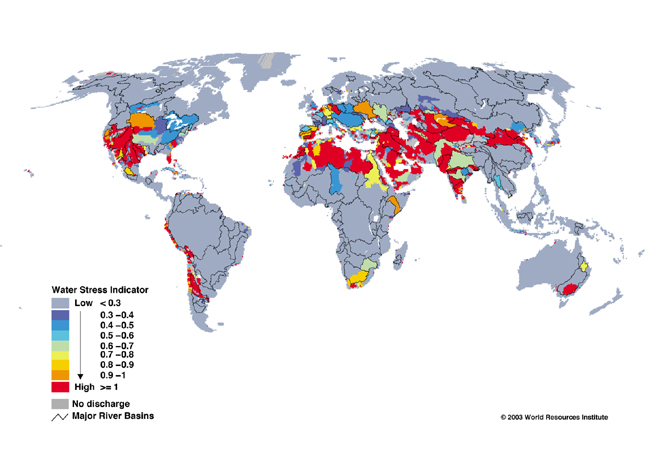
Water scarcity is a global problem and is not confined to “poor” nations.

Global Water Stress
Global Water Stress (scource: World Resources Institute)

In the US, we are now seeing headlines about droughts in places like Florida, Georgia, etc. – not your traditional areas of drought. A powerful way to understand the pervasiveness of America’s water scarcity problem is through the following pictures.

This first picture shows areas of the US that are experiencing moderate (yellow), severe (red), and extreme (purple) drought.

US Drought Map (source: NOAA)

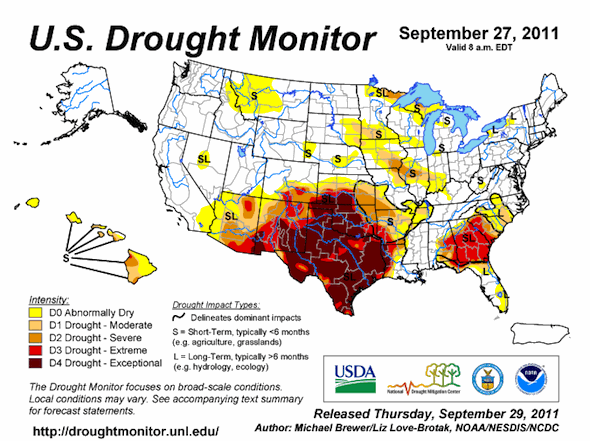
The picture above is constantly updated, and now, in fall 2011, Texas is experience unprecedented drought. I was driving through Texas a few weeks ago, and at that time, local radio stations talked about how Austin, as just one example, had experienced 72 days in a row of 100 plus temperatures. Here’s a picture of the current (September 27, 2011) drought situation throughout the US. Note that drought levels in most of Texas are at level D4 – “Exceptional.”

US drought map
US drought map - September 29, 2011 (source: NOA, NESDIS, NCDC)

These dry conditions have fostered endless fires that are sweeping across Texas and throughout the Southwest. Predictions are that the drought will likely last for years. Planners will need to make sure public policy on water conservation are in line with emerging water scarcity conditions. When does a drought become a desert?

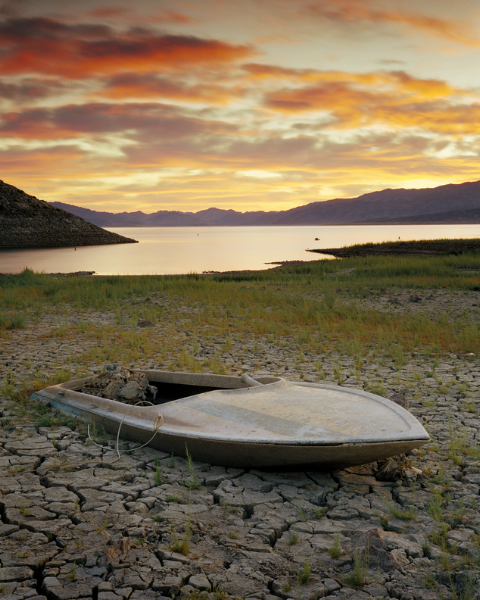
Shifting the lens toward the Southwest, here’s a picture of Lake Meade, boating haven and water source for Las Vegas. Current estimates predict it will be dry in the next 4 to 10 years.

Lake Meade water scarcity
A picture of the fast disappearing Lake Meade taken in 2007

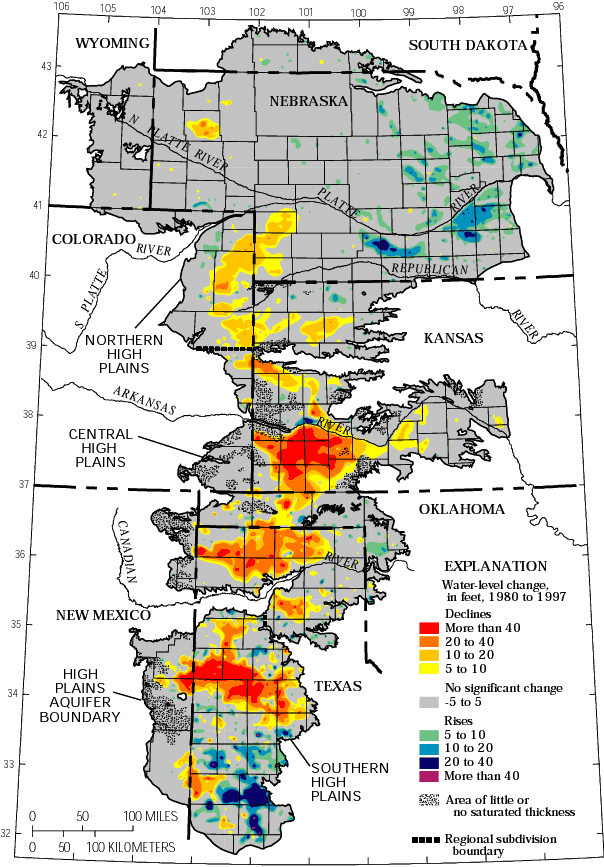
Food production in the “breadbasket” of the US depends on water from the Ogallala Aquifer.  The picture below shows where the sharpest declines in water level are occurring.

Ogallala Aquifer water shortage
Ogallala Aquifer (source: USGS)
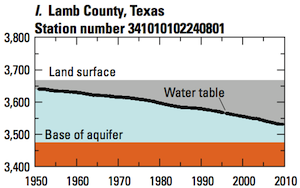
well-level changes in aquifer - Lamb County, Texas
(source: USGS)

The USGS monitors over 9,000 wells throughout the aquifer. Zeroing in on Texas again, here’s a picture of a typical well in Lamb County, Texas. Monitoring of this well started in about 1950, when irrigation began. This well shows a water table that has fallen steadily, and at current draw rates, this well will be dry in the next decade or so. How will farmers, who depend on a reliable source of water to grow crops and ride through accelerating drought, stay in business? How will the drying of the Ogallala Aquifer effect America’s ability to feed the nation?

A recent article in The Texas Tribune sets out the impact Ogallala water scarcity will have on Texas.  This story is not unique and is being played out throughout the 8 state region covered by the Ogallala.

Highlights of the Tribune article:

  • The Ogalala aquifer stretches across 8 states and accounts for 40 percent of water used in Texas.
  • The Ogallala’s volume will fall a staggering 52 percent between 2010 and 2060.
  • The use of big pivot irrigation — the lifeblood of the Panhandle — could be cut back severely in 10 to 20 years.
  • Texans are probably pumping the Ogallala at about six times the rate of recharge.
  • Water conservation and regulation policy is difficult to implement because Texas views groundwater as essentially a property right.
  • T. Boone Pickens business Mesa Water and other companies are buying up water rights, and looking to market water to cities like Dallas.  This is creating a variety of court challenges in the struggle to define the line between public and private water rights.

For more information on the critical issues around private and public access to water, read the well-researched Blue Gold by Maude Barlow and Tony Clarke.